
Python Research in Brazil 2022
Table of Contents
Python Research in Brazil 2022#
Once again on Telegram, I felt the urge to obtain numbers to better understand the Python community in Brazil. In the Python Brasil group, we have over 5000 members (March/2022), but many do not participate in discussions, others come and go. The idea was to circulate a survey with Google Forms in the groups and via Twitter. What is the age range? Which version of Python do they use? What IDE? What do they work in? Where do they live? The challenge is to find a middle ground with a number of useful questions so that more people participate in the survey.
Acknowledgments#
First, I would like to thank Felipe Cifali and Paulo Haddad, administrators of the Python Brasil group on Telegram, who supported me from the beginning, allowing me to use the group to promote the form and report daily on the progress of the research. The same goes for Eduardo Mendes, who also supported the research in the Live de Python group. Other people also helped to spread the word via Twitter, such as Ingo (La Sombra), Helio Loureiro, among others, humans and bots :-D.
To Professor Fernando Masanori, who included us in his mega network of followers and helped enormously in promoting the research. To the professors of the PythonBrEdu (private) group who massively promoted the research in their institutions, causing Rio Grande do Norte to reach second place in participation, right after São Paulo! To Professor Adorilson Bezerra, who spammed among the professors of the Federal Institutes. To Professors Antonio Santos Jr (IFAM-AM) and Danielle Valente (UEA-AM), who helped promote the research in the state of Amazonas!
To all the people who helped with the research and especially to all who responded.
Declaration#
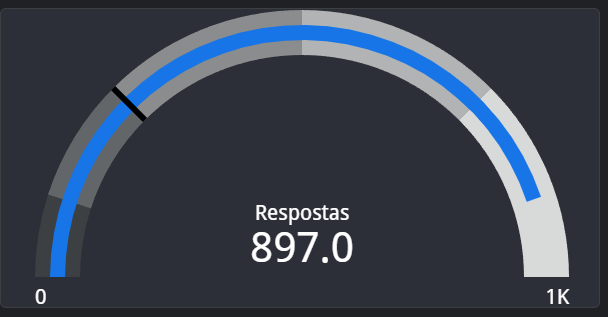
Conducting a survey is not as easy as it seems. With 897 responses, only one person complained about the Google login. The login was requested to allow the person to edit their responses and also to prevent the same person from responding multiple times. At no time did Google send me their email, unless you added it in the field to be contacted. The more personal responses were removed, as it is impossible to generate graphs and statistics with them, but I am reading each one. Every care was taken to keep the results available and anonymous. If you find something that is private or should not be disclosed, please contact me on Telegram (@lskbr) and I will update the file. Some people (2) included their emails in all fields of the survey; I considered this a test.
In some questions, the number of responses is not equal to the number of participants. When this number is higher than the number of participants, the question is probably multiple-choice, and each response counts. When this number is lower than the number of participants, it can be explained by: removal of completely nonsensical responses (level Zé) and participants who did not answer the question.
The version of Google Data Studio is accessible to visually impaired individuals.
This research was conducted with the support of the Python community in Brazil and abroad, but it does not constitute an official survey and has no relation to the Python Software Foundation or the Python Brasil Association. All opinions and interpretations in this article were based on the data collected and my interpretation of the results.
Data Preparation#
From the beginning of the research, I was concerned about not collecting private data from participants. During the data preparation, each column was analyzed, with emails and other identifiers being removed. A good normalization job was also done, as the programs that visualize the data are sensitive to changes between uppercase and lowercase letters and other details. The most challenging fields to work with were those about professional level and current title. You can (download the data) raw, without normalization, and the normalized version I used to show the results (links at the end of the article).
Collection Period#
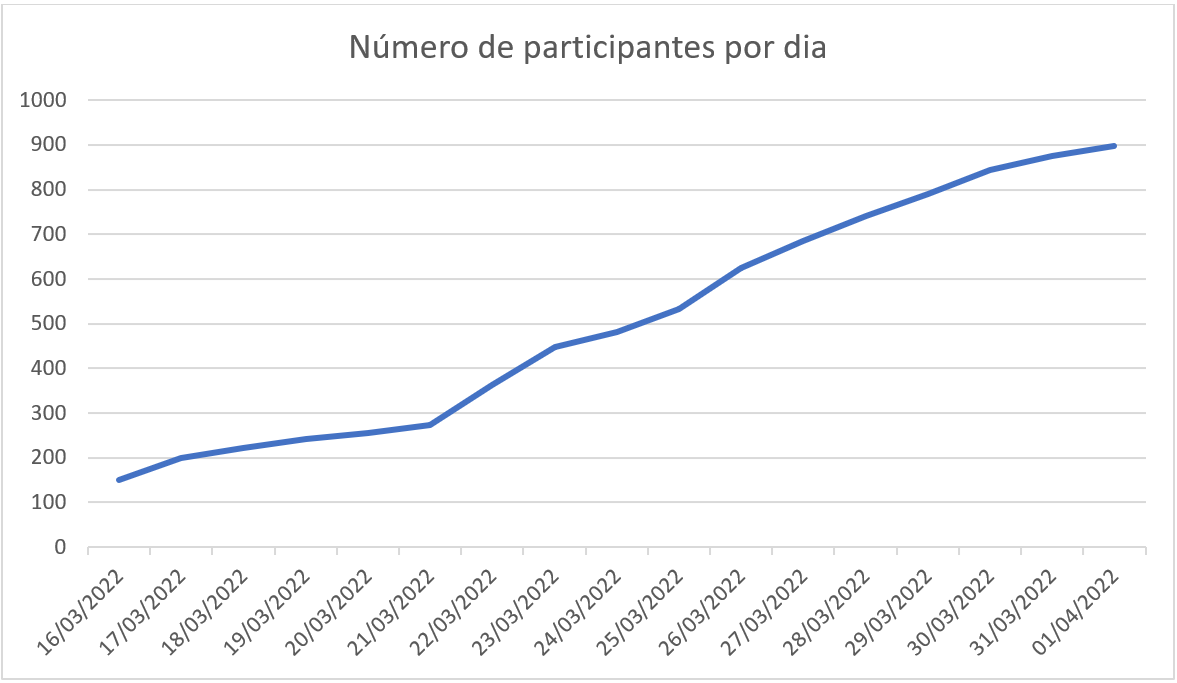
The survey was open from 03/14/2022 to 03/31/2022. Every day, in the morning, I recorded the number of responses received up to that point. The log was in the post (link removed) (from 03/16). The support of several people to promote the research is very important. The announcement should be made daily to obtain the highest number of responses.
In a future survey, I will try to work on supporting the research even before starting the promotion.
Results of the 2022 Survey#
Version of Python Used#
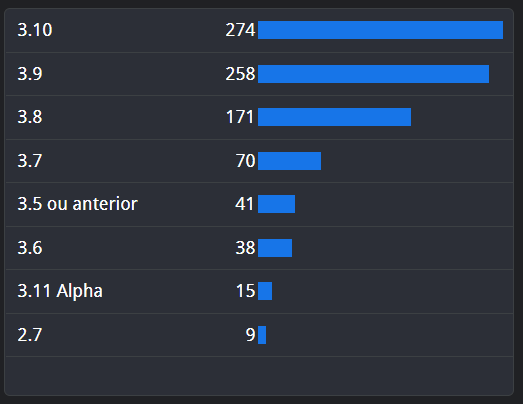
No surprises here, the most used version is 3.10, the most updated, followed by the previous versions (3.9 and 3.8). Fortunately, very few still use version 2.7, which is no longer supported and over ten years old. The use of the latest version can also be seen by a high number of people learning Python now, usually installing the latest version available on the download site.
Population#
The age of the participants is also not a surprise; the vast majority are between 26 and 35 years old, but there is a significant portion between 36 and 50. This shows that Python is very active among beginner professionals, but also among more experienced professionals. We even have a significant part of those over 51 years old.
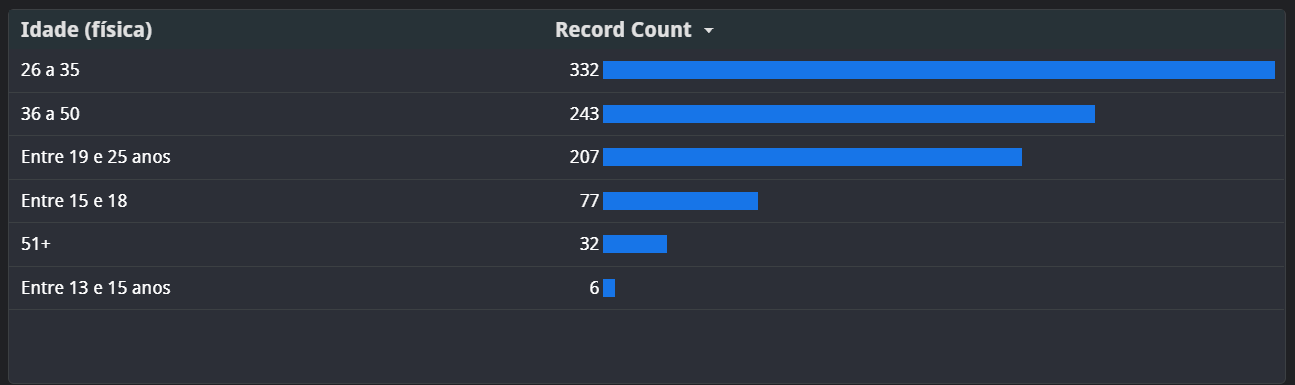
The age range between 19 and 25 also includes several people, at the key ages for the first higher education course and in search of the first job.
The surprise was the low number of young people between 13 and 15 years old, but I believe this result is affected by the channels we used to promote the survey.
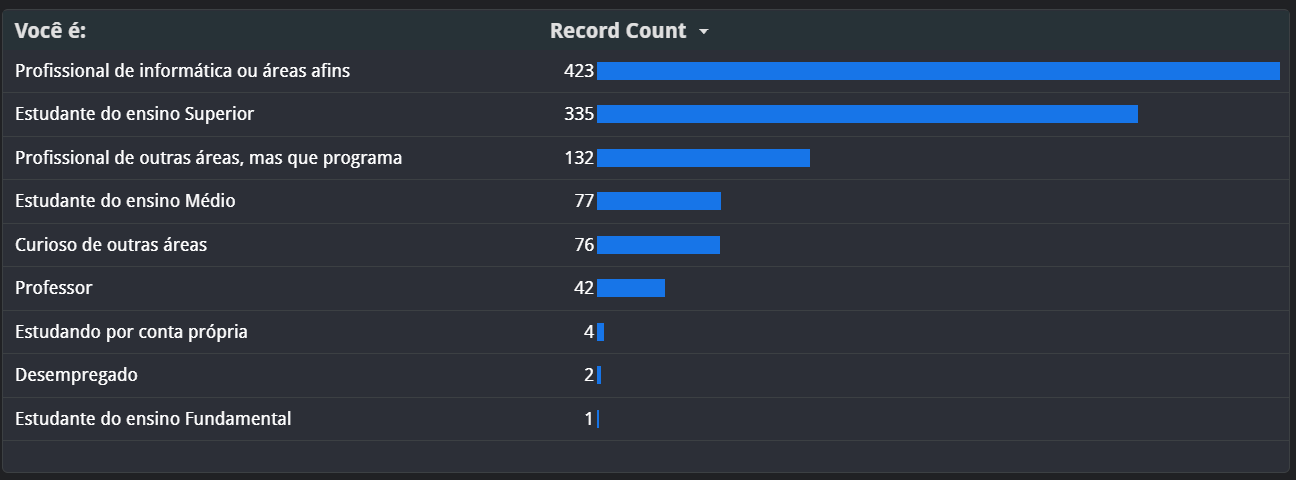
Most of those who responded to the survey are IT professionals (or related fields) and higher education students. It is interesting to note that Python is a language used both professionally and in teaching and research. It is a language with excellent adoption in other areas as well.
Equipment#
The vast majority use a laptop to program. This question was raised by the growing number of help requests from those who use their cell phones to program.
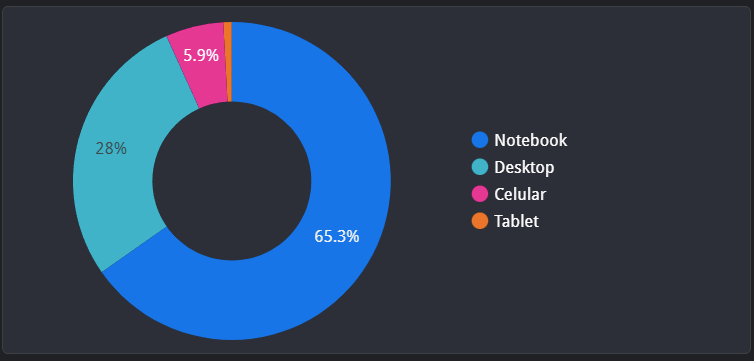
Although only 5.9% of respondents use their cell phones, it is still a significant number. One question that remains is whether the survey was accessible for mobile devices (cell phones) or if the use of these inhibited or discouraged participation in the survey.
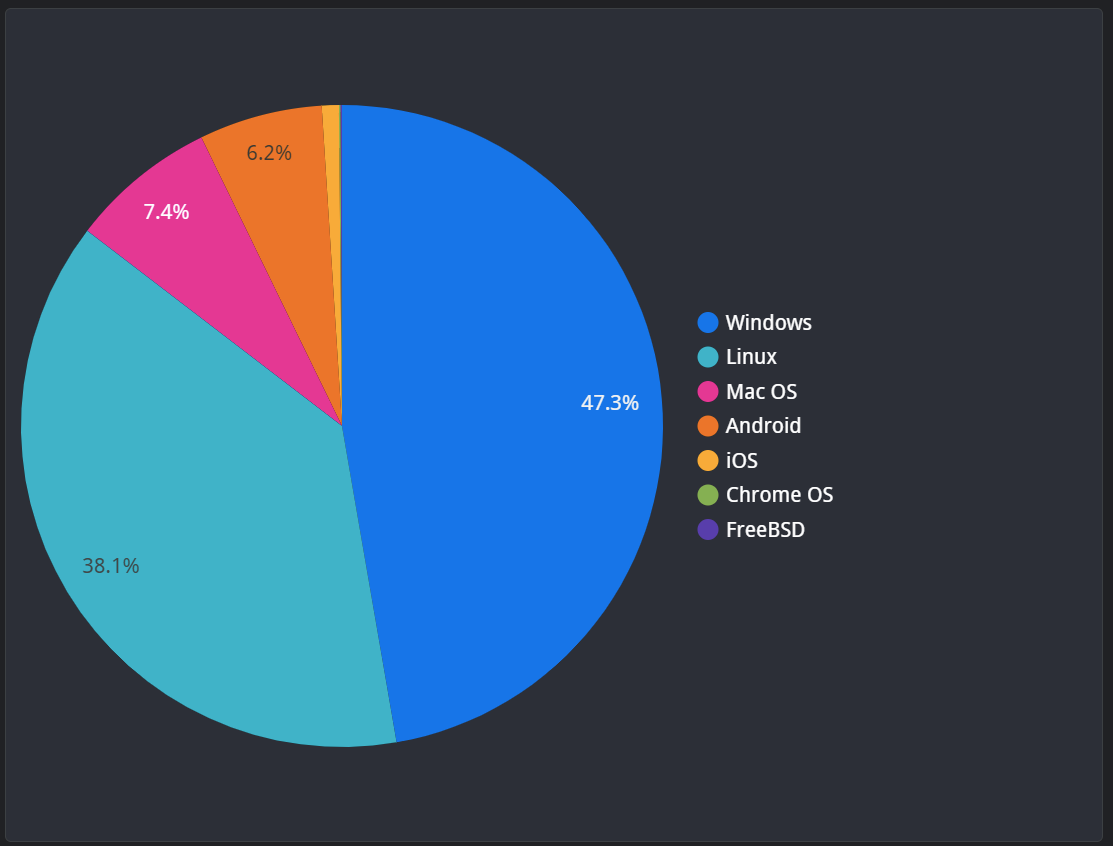
As for the operating system, unsurprisingly, most use Microsoft Windows, but there is an honorable second place for Linux, with 38.1%.
Text Editors#
One of the most delicate subjects of this survey is which text editor/IDE is most used by those who program in Python! With 41.1%, Microsoft’s Visual Studio Code is in first place, impressive for a relatively new product on the market. This success can be explained by the impressive number of extensions available for this editor.
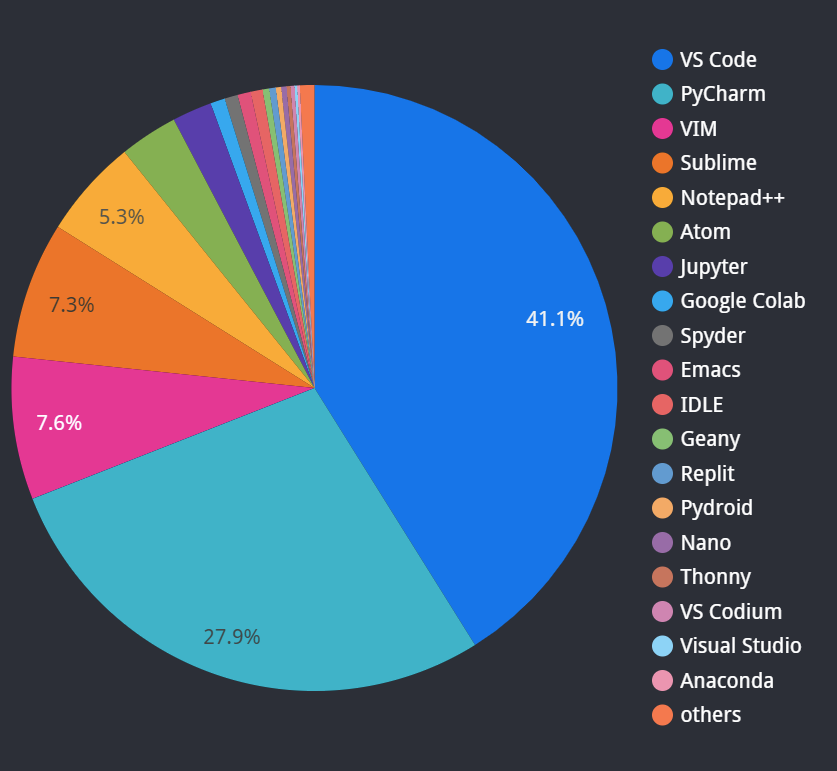
In second place, we have PyCharm with 27.9% and the old Vim with 7.6%. I believe that PyCharm tends to be less used over time as more people start to discover VS Code. Vim has been on the market for over 40 years and is not likely to change anytime soon. Among the old editors, Emacs was represented with 0.7%.
Use of Python#
Given the population of the survey, the first place for the use of Python was quite close, with logic programming exercises and web applications in first and second places, respectively.

Followed by data science, databases, and scripts.
Unfortunately, “evil sciences” continue to be represented in the survey with 3% of the results. It is important to note that this option was chosen more than security and that many participants wrote “ransomware” in their responses. This result can be explained by several factors: joke, lack of awareness, rebellion. The joke is easy to understand; the option was written to be funny, although the subject is serious. The lack of awareness that these activities are criminal is shocking but not surprising, given the rebellious acts against the system of youth (constant, regardless of the time or generation). The hope is that these 3% use this knowledge to delve into issues such as security and system protection.
Ways to Learn#
Free courses (23.9%) are still the most used way to learn Python, followed by self-taught (23.7%), videos (19%), and books (13.5%). This indicates a good change in the way of studying and learning Python, especially considering that a good part of the courses are conducted remotely or via video. In a future survey, separating how the person participated in the courses and whether they were free or paid could be interesting.
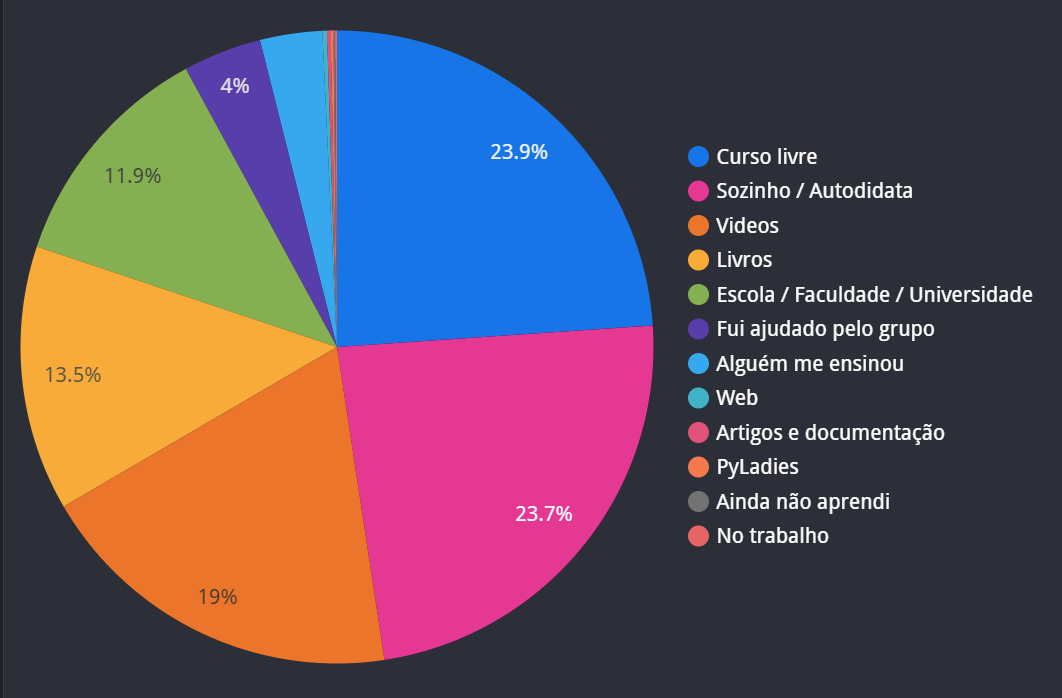
A topic for another survey is what leads a person to choose a particular medium. I believe there are two factors: access and price. It is very easy to access videos, and the content is usually free. It remains to be seen whether people watch the entire course, but that will be for 2023.
Telegram Group#
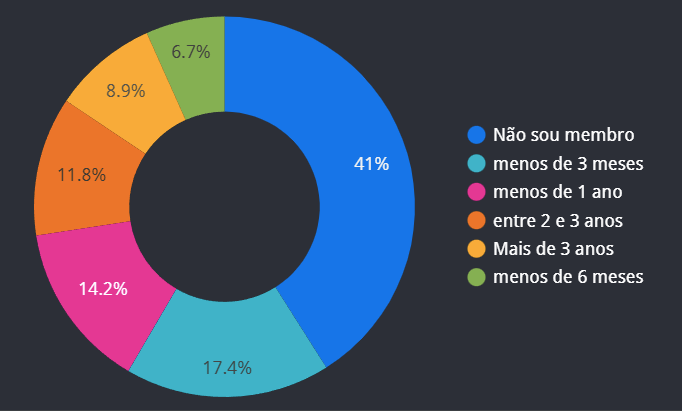
Here, the results were truly surprising. 41% of respondents do not even participate in the Python Brasil group. This shows the effectiveness of other means (Twitter) and confirms that we managed to reach more people than those who participate in the group on Telegram. Moreover, over 30% of participants have been members for less than a year.
Among the positive points of the group are the exchange of experiences and the friendly environment. These two items are largely thanks to the Python community and the great work of the moderators who control what is discussed in the group every day.
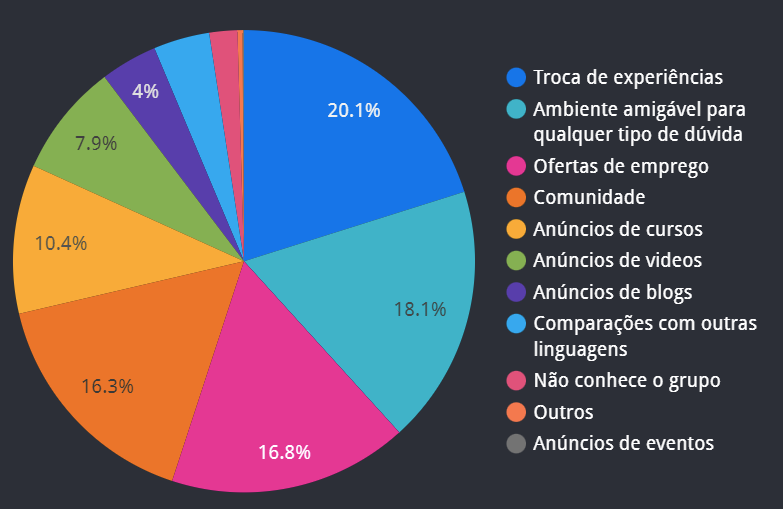
The popularity of job offers was a surprise, as was the announcement of courses.
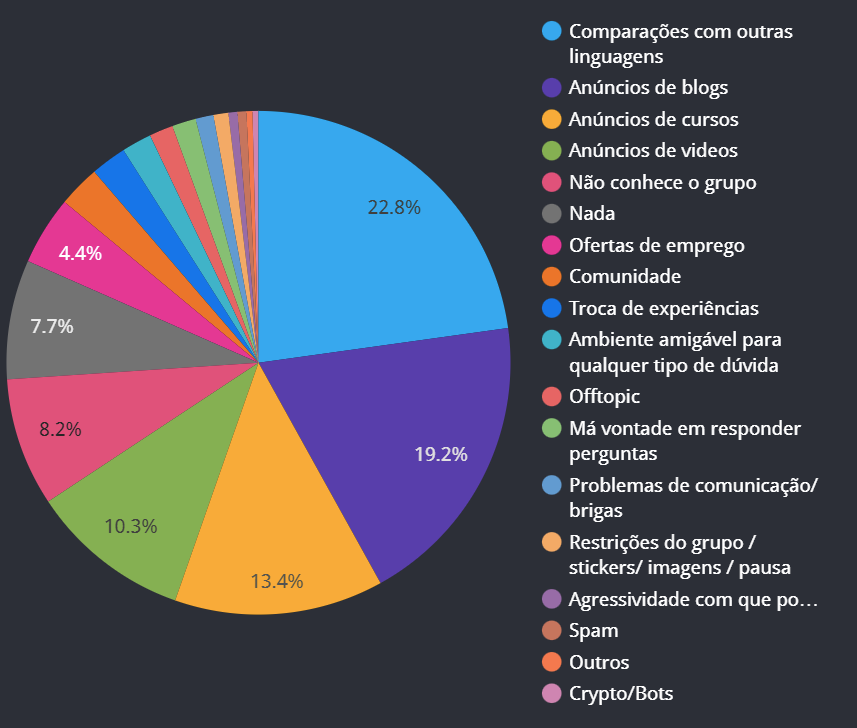
As for what people do not like, we have comparisons with other languages, blog ads, and course ads (also present in the list of what people like the most).
The Association#
Another surprise was the great unawareness of the existence of the Python Brasil Association.
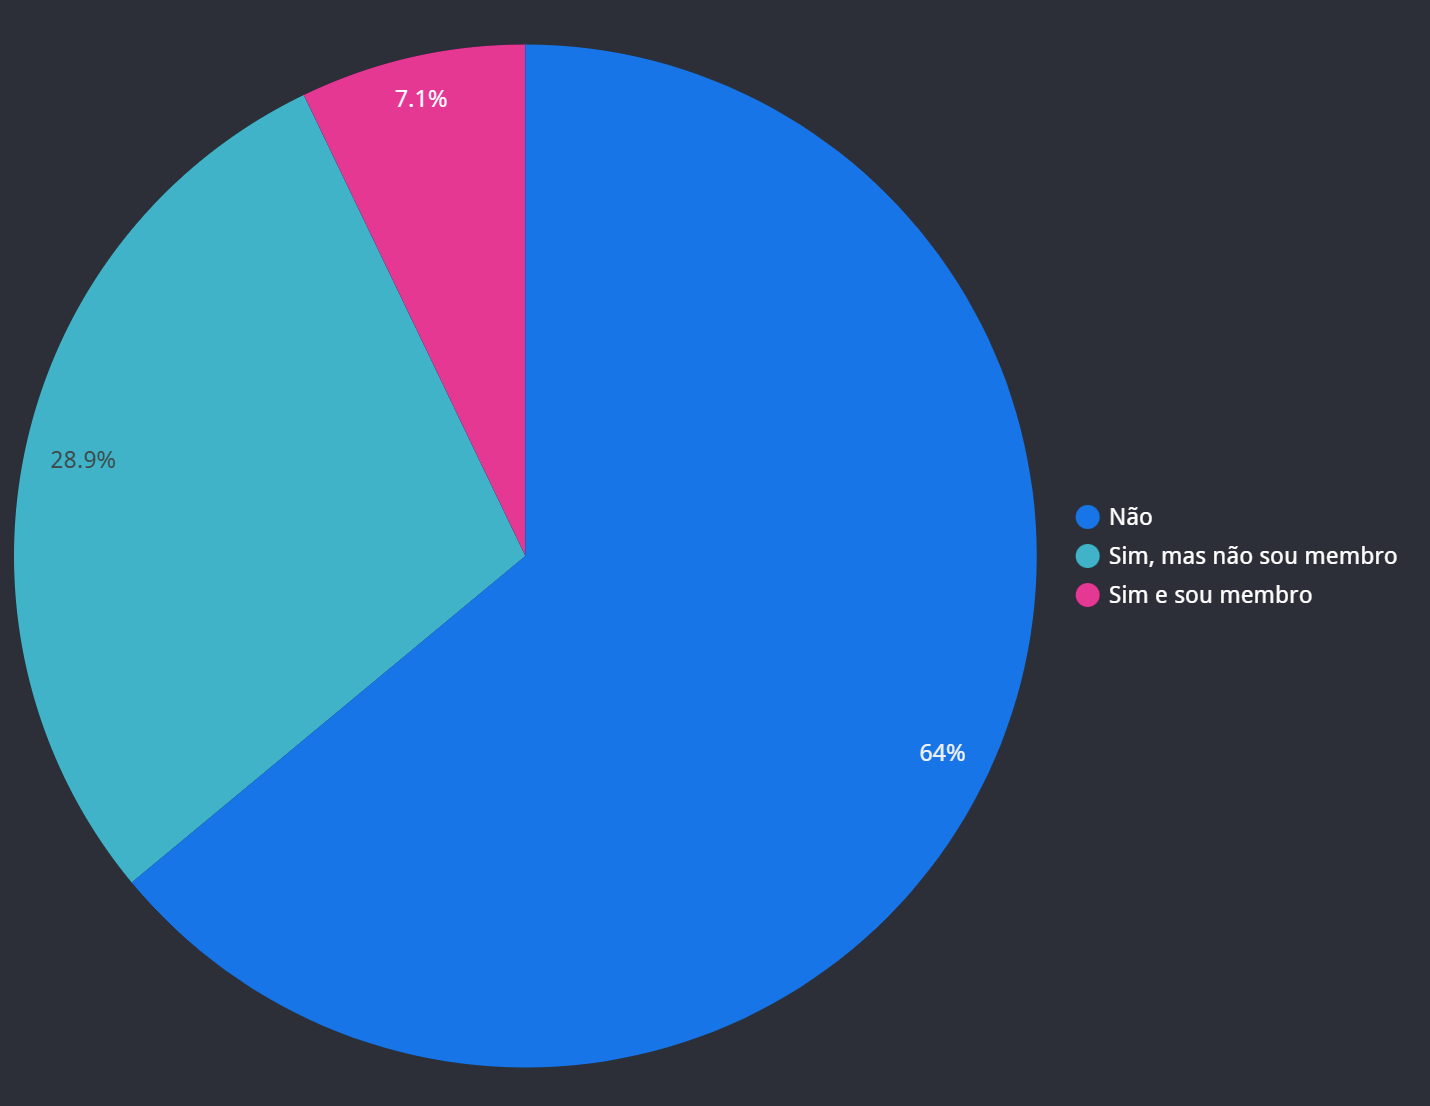
This result can be explained by the fact that the Association was created to issue invoices for events and support the receipt of sponsorship. Of those who responded to the survey, only 7.1% are members of the association, and 64% did not even know it existed. In a future survey, we can ask about regional groups and PyLadies as well.
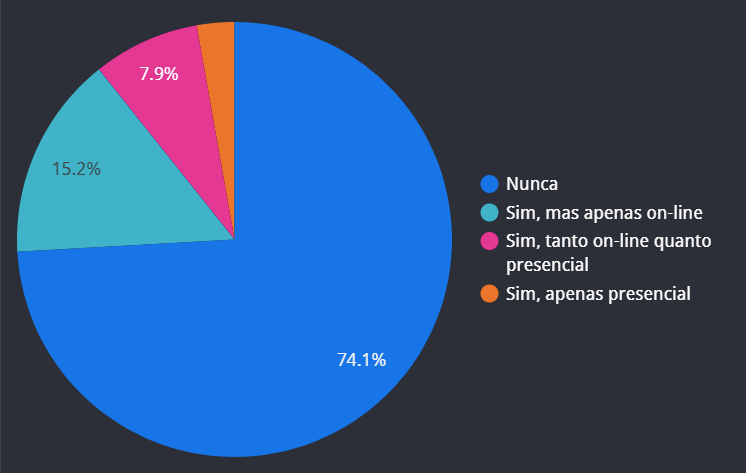
Python Brasil#
Most have also never participated in a Python Brasil, either online or in person. Perhaps this number can be explained by the large number of people who have participated in the Telegram group for less than a year.
As for presenting at Python Brasil, 6.3% have presented at the conference at least once.
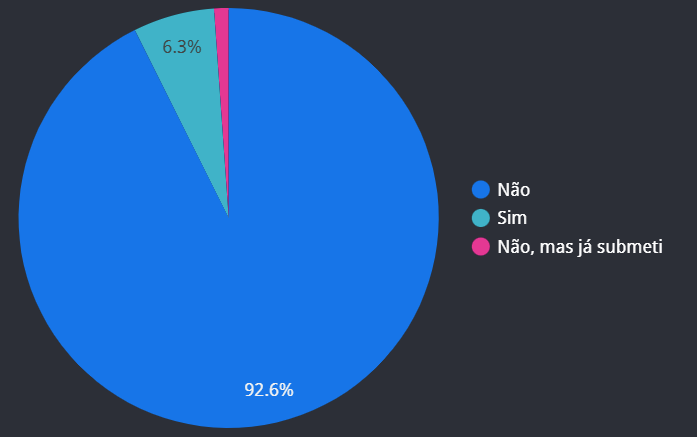
Another 1.1% submitted but did not have their presentation selected.
Salaries and Education#
Without a doubt, one of the most interesting parts of the survey.
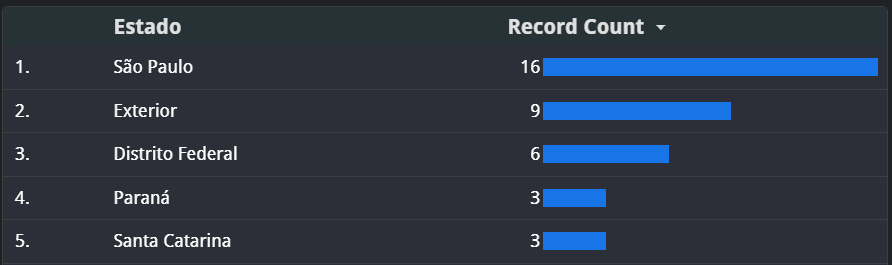
Here we can see participation by state. The more participants, the bluer the state becomes.
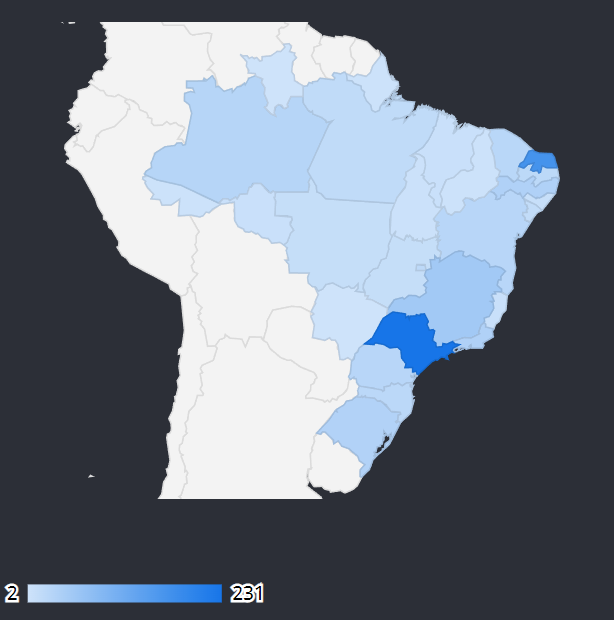
Participation from each state was not proportional to the size of the community or even the population of each state. The large number of participants from Rio Grande do Norte was due to a more intense promotion campaign, the same for the state of Amazonas.
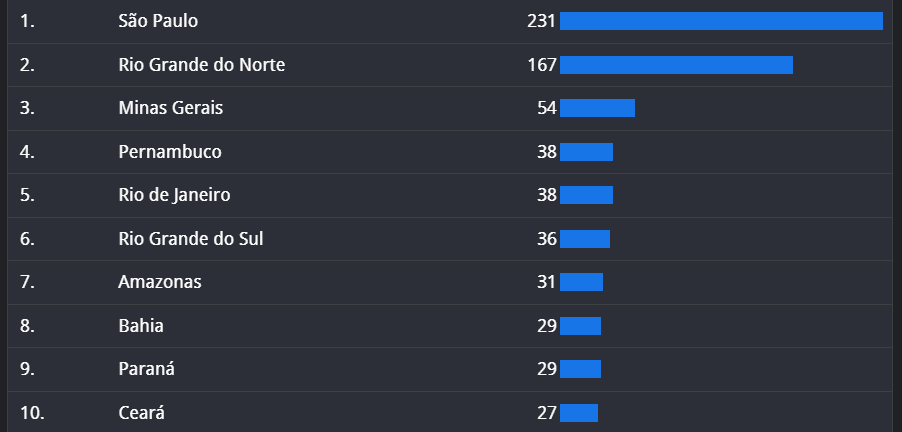
Still, we had participation from all states in Brazil and counted with 5 participants from Acre and 2 from Roraima. The overseas team also participated with 23 responses.
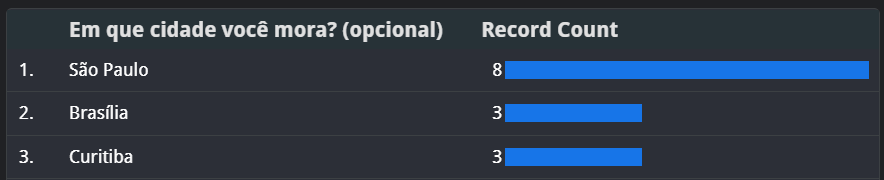
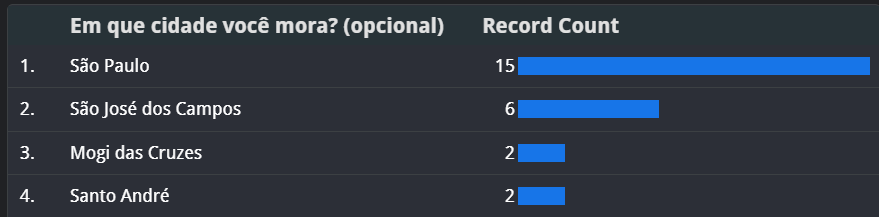
The main cities also bring interesting results.
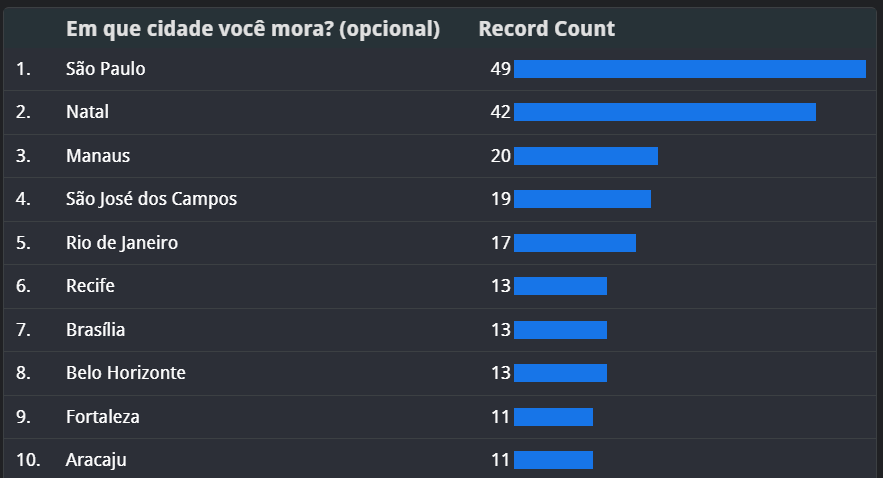
São Paulo, as expected, Natal, and Manaus due to more intense promotion campaigns, but also interior cities like São José dos Campos (Masanori?) ahead of capitals like Rio de Janeiro and Recife.
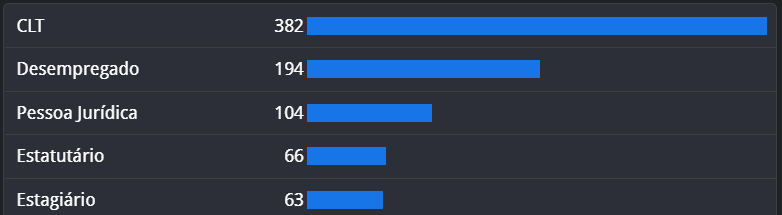
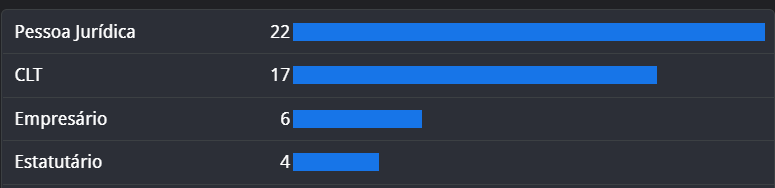
The most used contract is still CLT, the traditional employment. Followed by legal entities. The large number of unemployed may be related to the number of students who participated in the survey. I believe that a distinction between students and unemployed should be highlighted in a future survey to clarify.
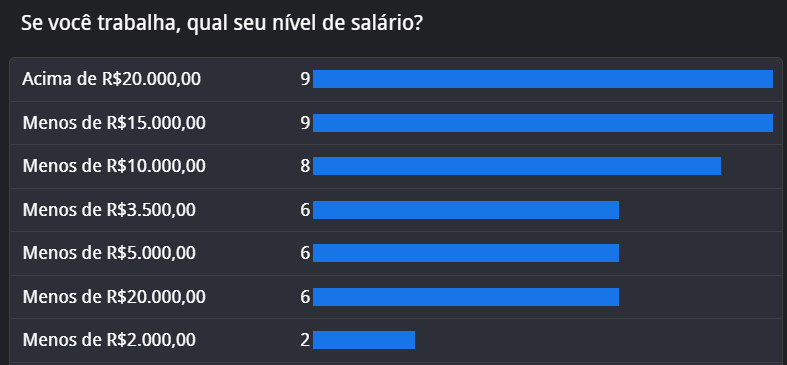
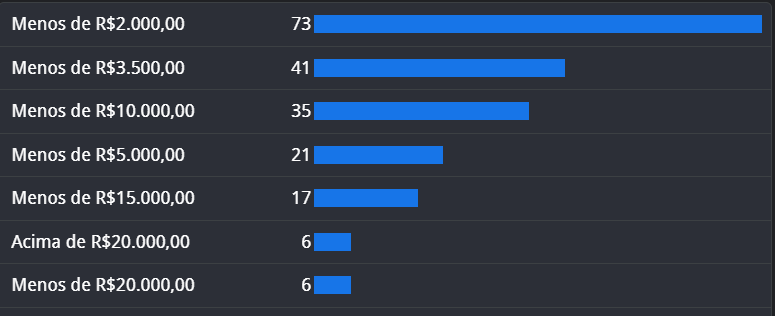
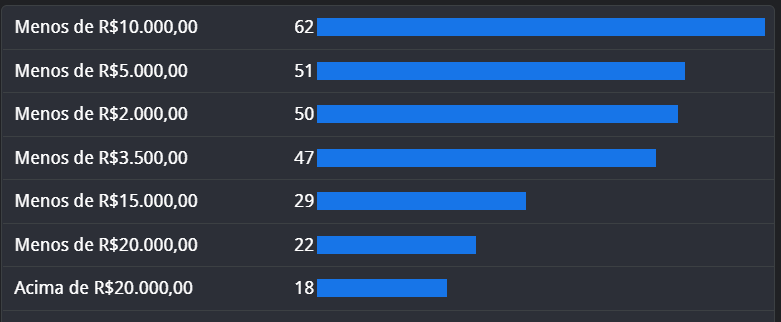
As for salaries, the vast majority earn less than R$2000.00 per month. A large part earns between R$5,000.00 and R$10,000.00 per month, values influenced by the large number of students, interns, and juniors who responded to the survey.
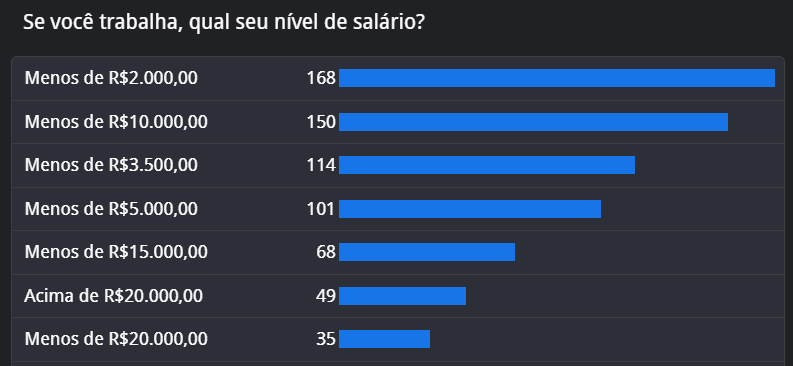
Here, the use of filters in Google Data Studio can shed light on some questions. How does remuneration change with the type of contract? You can filter only CLT or PJ contracts. By working with the filters, various scenarios can be created. The page and the link are included at the end of this article, and you can create filters using the web page.
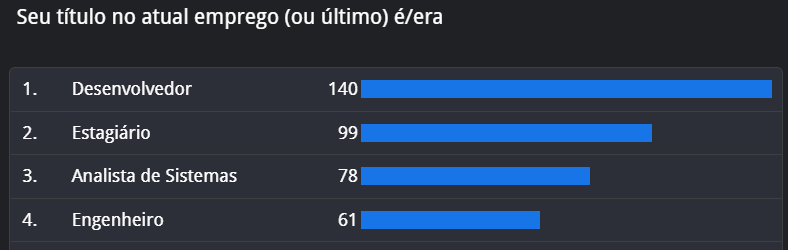
A good portion of participants is hired as developers, with a large number of interns, followed by systems analysts and engineers.
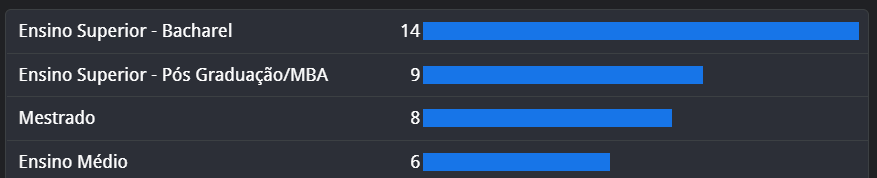
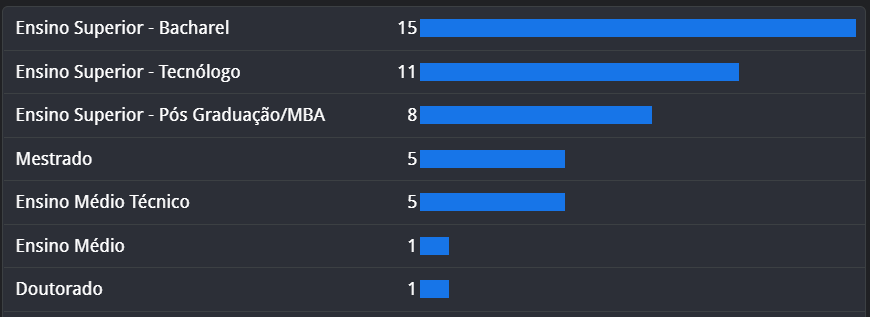
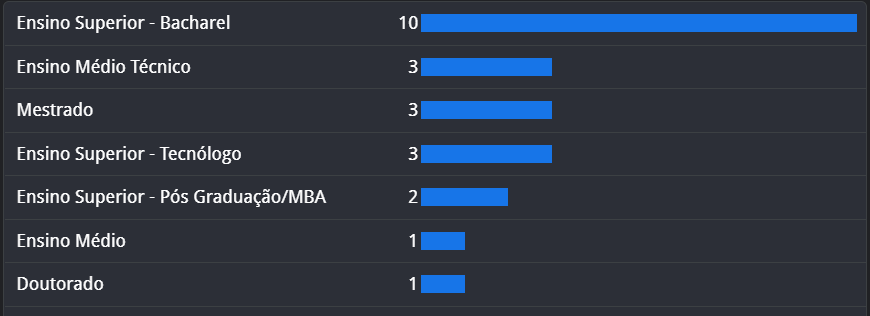
The level of degrees is also quite high. We even had 19 PhDs respond to the survey, although the reliability of these results is not very high (PhDs with less than 15 years).

A large part of the professionals has a higher education degree or is currently studying.
Another difficult question was the level of the current position. Here, people really used all their imagination in the “other” responses.

The vast majority are at the beginning of their careers, working as juniors.
The PUGs were difficult to normalize; each person wrote differently. Although an effort at standardization was made, the results still need more work. I recommend filtering by state to get an idea.
Working with Some Filters#
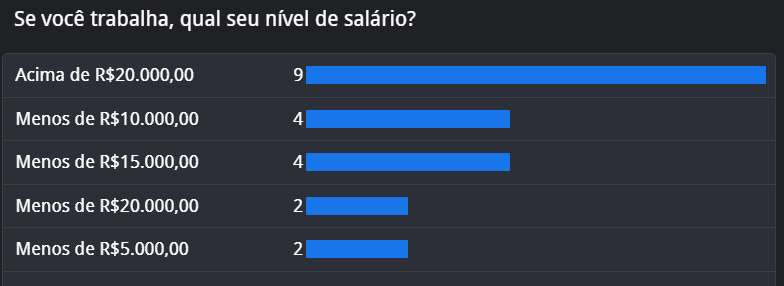
Using Google Data Studio, we can answer some specific questions. For example, where do people who earn more than R$20,000.00 per month live?
Earning more than R$20,000.00 per month#
In which states?
In which cities?
With what level of education?
In what type of contract?
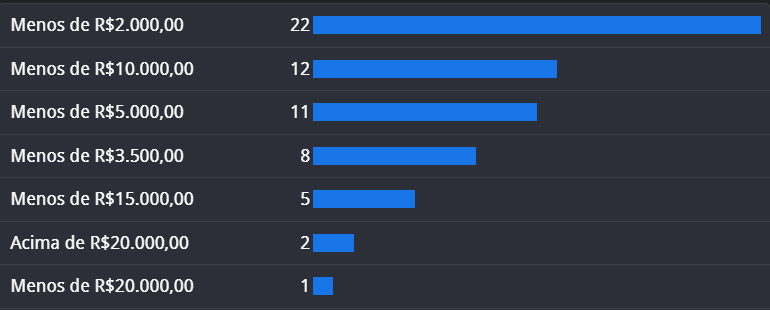
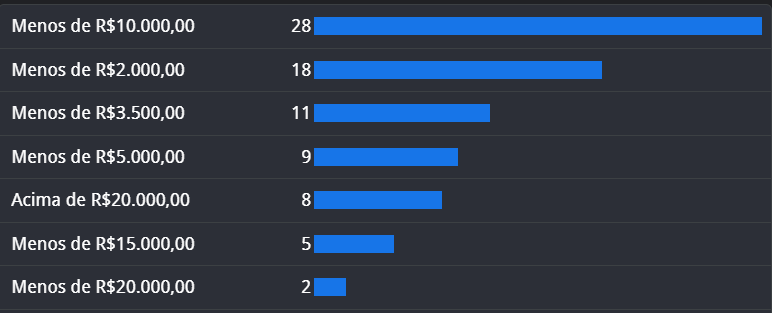
How much does a person hired as PJ in São Paulo earn?
With what diploma?
In which cities?
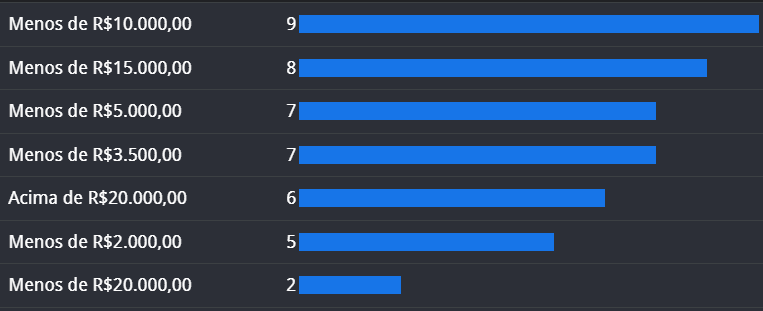
Salaries Abroad#
With what education?
Salaries in Northeast Brazil#
Salaries in Northern Brazil#
Salaries in Southern Brazil#
Salaries in Central-West Brazil#
Salaries in Southeastern Brazil#
Lessons Learned#
Think carefully before allowing multiple-choice fields.#
They do not allow prioritizing choices, and every time someone chooses more than one option, it is as if someone voted twice. Another problem is that Google Sheets really does not like the idea of having multiple values in a single cell. To facilitate the analysis of this data, other spreadsheets were created (via script), repeating the fields and placing each multiple choice in a single line. There is an option where the person can order the response options that deserves to be explored.
Make the questions very clear#
The understanding of the questions can vary enormously. For example, the city where one lives was not clear. Some people filled in where they were born. The goal was to know where they were when they answered the survey. The difference becomes clear when we compare with the groups the person participates in.
The question of unemployed and student also remained ambiguous. In my understanding, unemployed is someone looking for a job and not currently working. The student studies to later look for a job. Professionals seeking requalification also did not make it clear whether they are currently employed in other areas or unemployed and looking for a job.
The logic used to answer these questions is easy to understand. The questions need to be better explained. Probably a small text after each question would help clarify the objective.
Chain of Questions#
Some questions should be skipped when a response is chosen. For example, when a person is a student, skip the profession section. The same for people without a job.
Other Field#
In several questions, an “other” field was made available. Here, people wrote all sorts of things. Classification problems abounded, but normalization helped to resolve them. For example, unemployed and without a job or just study instead of student.
Future Work#
For 2023, we will probably need to replace Google Forms with another program and new questions. Although it was difficult to work with the “other” field, they help discover values not considered during the creation of the options.
Ideas include asking about packages used to develop applications, more details about remuneration, and how the person learned Python. We didn’t even touch on what people found most difficult and what materials are lacking to help learn faster.
Some people contacted me to include gender options with the aim of getting an idea of inclusion and also salary disparity. I do not feel competent to elaborate such a survey, but I will help as much as I can for those who want to organize such surveys. I believe that a researcher in the humanities area is necessary to properly elaborate such questions and treat the data appropriately. These are much more serious subjects, and I consider that they cannot be treated in an amateurish way.
Conclusions#
The vast majority of people treated the survey very positively. Of course, it is not possible to please everyone, but I believe that the survey was very well received.
The results show that a future survey may need a more robust software than Google Forms.
For a first survey, the result and the reach were very good. With the support of the community, I believe that the 2023 survey will be even more interesting. Exploring the raw data can also present unexpected results.