
Python Research in Brazil 2023
Table of Contents
Results 2023#
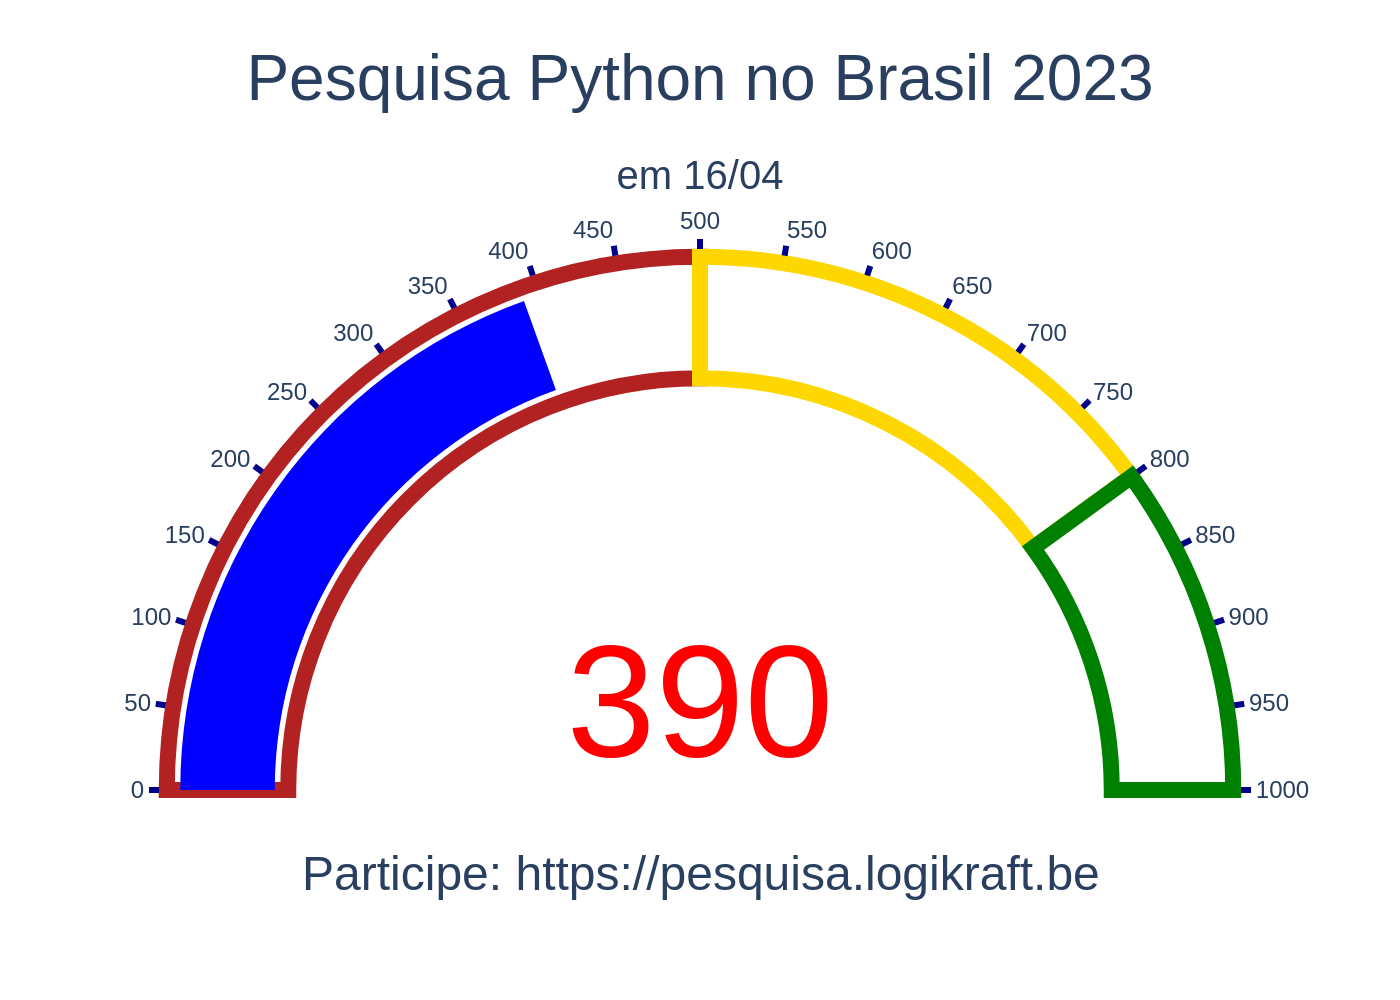
The 2023 survey was open from 03/01/2023 to 04/15/2023. This year had the unexpected characteristic of a difficulty in obtaining community participation. In 2023, participation was less than half of the responses obtained in the 2022 survey.
It all started last year, 2022, with the goal of better understanding the community and answering some questions related to training and salaries. In 2023, several questions were added to give greater visibility to remote work, as well as to frameworks and libraries used by the community.
The Python research in Brazil is a volunteer effort, organized by Nilo Menezes and supported by the community. There is no commercial use of the research; the data is not used to organize marketing campaigns, nor is it shared with third parties. All results, after being anonymized, are made available for others to analyze and draw their own conclusions.
Acknowledgments#
This year was quite difficult to organize the survey. I focused a lot on the survey program itself, and with my change of contracts and health issues, it wasn’t easy. The main difficulty was facing criticism from some community members and trying to market the survey without sounding like a marketer. ChatGPT helped with some tweets :-D
But we wouldn’t even have the results of 2023 without the help of community members who provided support and helped with the dissemination.
I would like to thank Felipe Cifali and Paulo Haddad, administrators of the Python Brazil group on Telegram. To Eduardo Mendes, who also supported the research and endured the criticism from the community while helping me adjust the questions. Fábio Bairronuevo, who helped a lot with the dissemination and also provided feedback. Débora Azevedo for her tips and willingness to answer my questions via Telegram. Other people also helped to spread the word on Twitter, like Ingo (La Sombra), Hélio Loureiro, among others, humans and bots (Bolha Dev!) :-D. To Filipe Deschamps, the only influencer who truly cared to respond to the participation message and provided some tips on where to disseminate the research.
This year, Professor Fernando Masanori could not help us as he was recovering; get well soon, Masanori. To the professors of the PythonBrEdu (private) group who beta tested Quest 2 and also helped me adjust the questions. To Professor Adorilson Bezerra, who once again actively participated in the campaign.
To all the people who helped with the research and especially to all who responded.
Declaration#
Conducting a survey is not as easy as it seems. Every care was taken to keep the results available and anonymous. If you find something that is private or should not be disclosed, please contact me on Telegram (@lskbr) and I will update the file.
This research was conducted with the support of the Python community in Brazil and abroad; however, it does not constitute an official survey and has no relation to the Python Software Foundation or the Python Brazil Association. All opinions and interpretations in this article are based on the collected data and my interpretation of the results.
The Survey#
In 2023, the goal was to obtain 1000 participants, as in 2022 we almost reached 900. However, the result was leaner, even though the survey was open for an additional 15 days (in 2022 it was only during the month of March).
Still, we received quite a bit of feedback from the community, and the results are interesting.
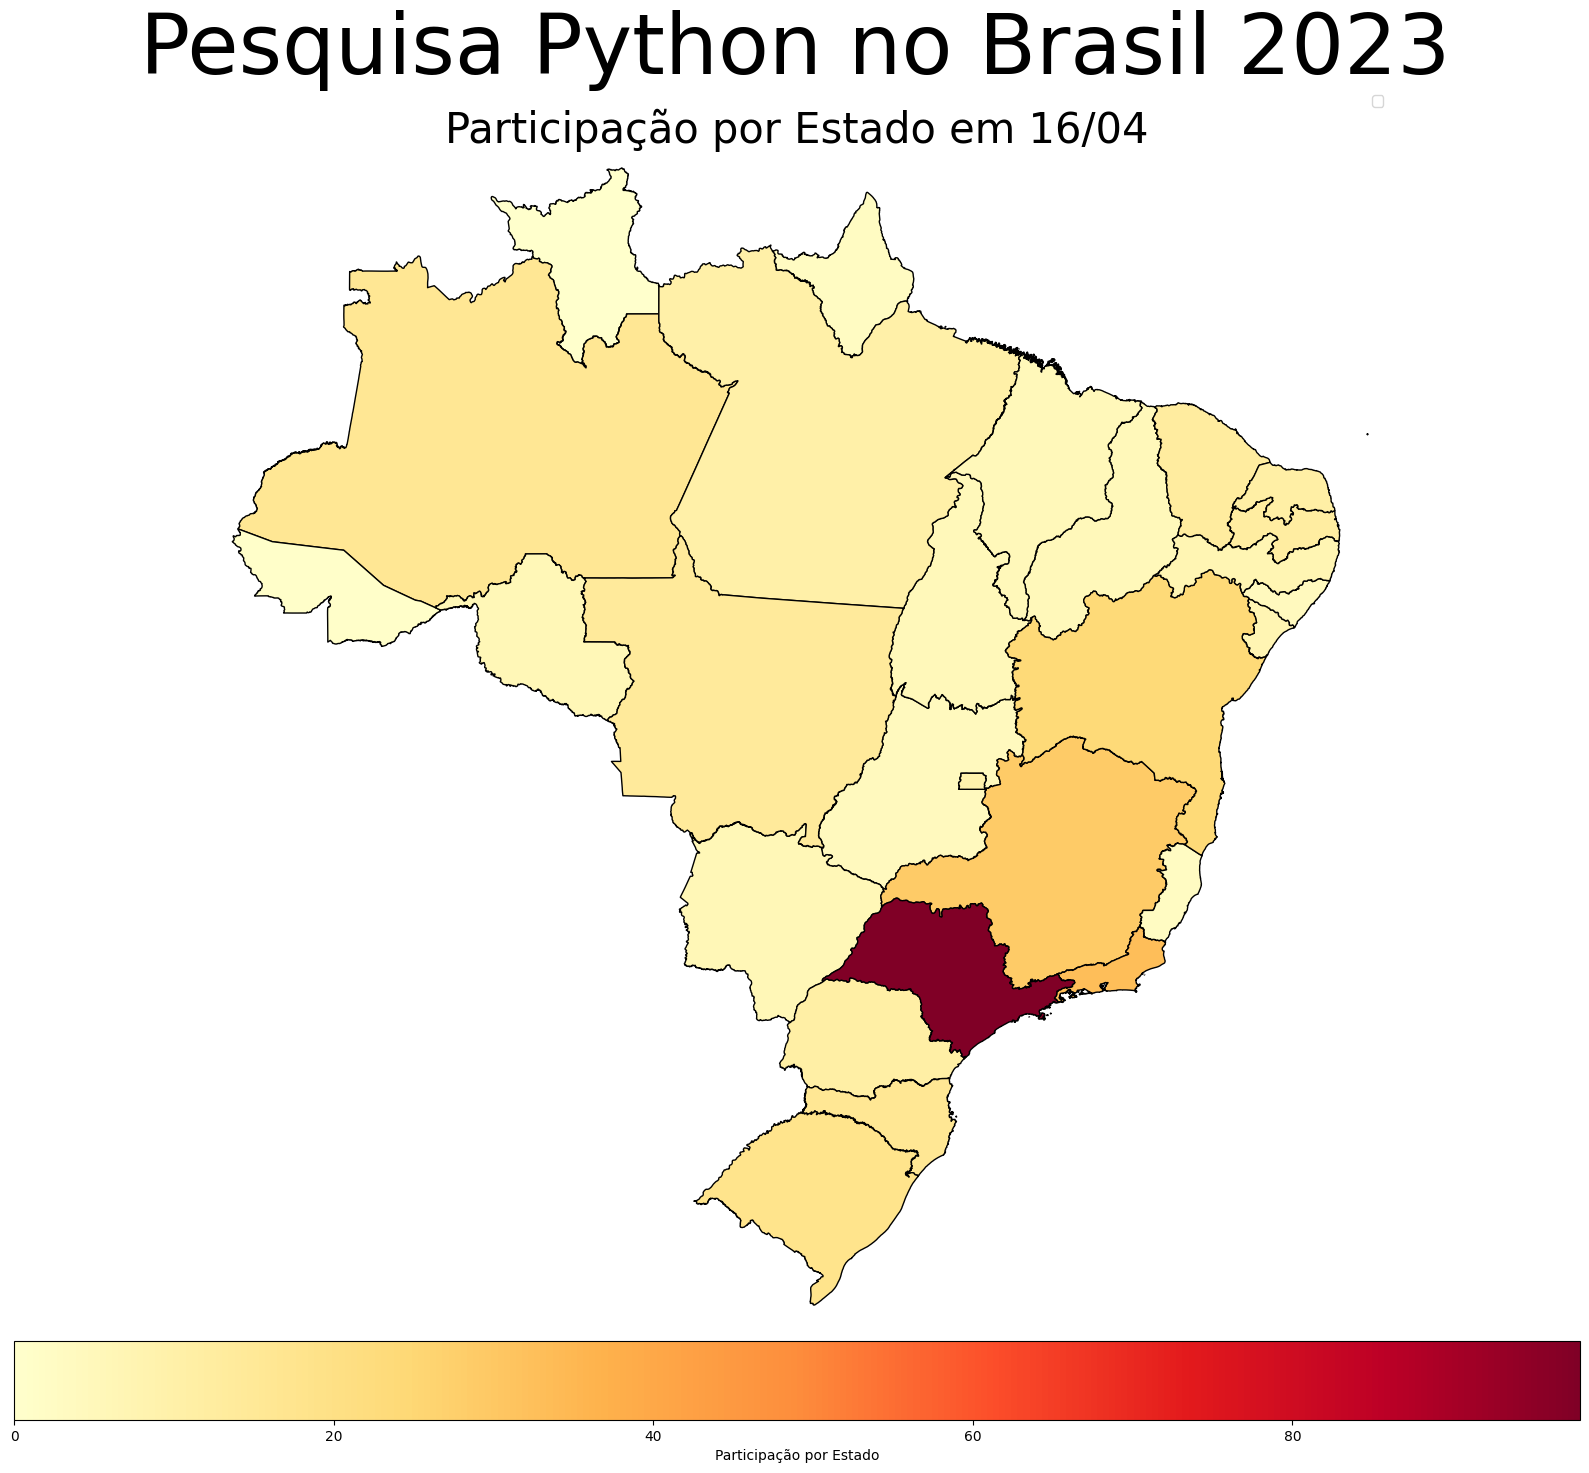
In 2023, we had participation from almost all states in Brazil, except Roraima (0.3% of the Brazilian population). One point of action could be to invest in the states that participated little to organize campaigns to promote the Python language.
| State | Participation |
|---|---|
| Acre | 1 |
| Alagoas | 4 |
| Amapá | 3 |
| Amazonas | 16 |
| Bahia | 24 |
| Ceará | 13 |
| Federal District | 9 |
| Espírito Santo | 3 |
| Goiás | 4 |
| Maranhão | 5 |
| Mato Grosso | 14 |
| Mato Grosso do Sul | 6 |
| Minas Gerais | 29 |
| Pará | 10 |
| Paraíba | 12 |
| Paraná | 11 |
| Pernambuco | 7 |
| Piauí | 5 |
| Rio de Janeiro | 33 |
| Rio Grande do Norte | 11 |
| Rio Grande do Sul | 18 |
| Rondônia | 6 |
| Santa Catarina | 16 |
| São Paulo | 98 |
| Sergipe | 7 |
| Tocantins | 5 |
Comparing participation by state with the national population, we have the absolute and relative difference.
| State | Participation in the Survey (2023) | Participation in the National Population (2018) | Difference | Relative Difference |
|---|---|---|---|---|
| Acre | 0.3% | 0.4% | -0.1% | -35.7% |
| Alagoas | 1.0% | 1.5% | -0.5% | -31.4% |
| Amapá | 0.8% | 0.4% | 0.4% | 92.8% |
| Amazonas | 4.1% | 1.9% | 2.2% | 116.5% |
| Bahia | 6.2% | 7.1% | -0.9% | -13.1% |
| Ceará | 3.3% | 4.3% | -1.0% | -22.3% |
| Federal District | 2.3% | 1.4% | 0.9% | 65.3% |
| Espírito Santo | 0.8% | 1.9% | -1.1% | -59.4% |
| Goiás | 1.0% | 3.3% | -2.3% | -68.8% |
| Maranhão | 1.3% | 3.3% | -2.0% | -61.1% |
| Mato Grosso | 3.6% | 1.8% | 1.8% | 99.9% |
| Mato Grosso do Sul | 1.5% | 1.4% | 0.1% | 10.2% |
| Minas Gerais | 7.5% | 10.0% | -2.5% | -25.4% |
| Pará | 2.6% | 4.1% | -1.5% | -37.3% |
| Paraíba | 3.1% | 1.9% | 1.2% | 62.4% |
| Paraná | 2.8% | 5.7% | -2.9% | -50.4% |
| Pernambuco | 1.8% | 4.4% | -2.6% | -59.1% |
| Piauí | 1.3% | 1.6% | -0.3% | -19.7% |
| Rio de Janeiro | 8.5% | 8.0% | 0.5% | 6.0% |
| Rio Grande do Norte | 2.8% | 1.6% | 1.2% | 76.7% |
| Rio Grande do Sul | 4.6% | 5.3% | -0.7% | -12.7% |
| Rondônia | 1.5% | 0.8% | 0.7% | 92.8% |
| Santa Catarina | 4.1% | 3.7% | 0.4% | 11.2% |
| São Paulo | 25.2% | 22.2% | 3.0% | 13.5% |
| Sergipe | 1.8% | 1.1% | 0.7% | 63.6% |
| Tocantins | 1.3% | 0.8% | 0.5% | 60.7% |
| *Roraima | 0% | 0.3% | 0.3% | 100.0% |
I believe that the reduced participation was caused by three factors:
- New survey program that requires login
- Low number of messages in the Telegram group
- Little community participation in forwarding the messages
The New Program#
The new program was developed to solve the problems encountered in the 2022 survey. The main issue was the lack of resources to adequately handle questions with multiple answers. For example, if you chose more than one text editor, we had no way of knowing which editor was the most used among them. In 2022, some people practically marked all the answers, which made analyzing the results even more difficult.
The program, called Quest 2, was developed for the web to replace Google Forms, which was used in 2022. Using TypeScript and Vue 3, a minimum program was created in a short time. The backend was written in Python with FastAPI and running on AWS with a Lambda function and a DynamoDB database. To support data processing, several scripts were written using Pandas, such as those that downloaded the daily results and created the map of Brazil, statistics by state, and the participation indicator, posted daily on Twitter and in the groups.
The survey was harshly criticized, and some people even campaigned against it due to the login requirement. Several fields were marked as optional because people did not even want to identify the city where they lived. In respect to the community, the city field was marked as optional and was not included in the public results. It is quite complicated to run a survey with many optional fields, as it compromises the analysis of the final results. Not asking for the city makes it difficult to know whether the person lives in the capital or in the interior of the state, for example. The level of distrust from some people is also exacerbated. I admire even more those who are capable of doing volunteer work these days; it has become increasingly complicated.
As explained in the video that accompanied the campaign, the login was required for several reasons, but the main ones were to ensure that the site would not be abused (multiple people responding to the survey or even using bots) and to allow users to edit their own responses. I reaffirm that at no time was the idea to collect emails or create any advertising campaign. Additionally, the European data management law (GDPR), similar to Brazilian law, requires certain precautions and grants individuals rights to have their data deleted. It is impossible to delete the data of someone you cannot identify! Since I live in Belgium and the servers run in Germany, there was no way to escape. Ah, I could run it in Brazil, but it would be more expensive and complicated for me… I haven’t lived in Brazil for 17 years! As I said, it’s difficult to do volunteer work these days :-D
The new program also allowed the creation of question chains, where one answer could enable or disable a sequence of responses. Another lesson learned during the 2022 survey, where it made no sense to ask a person about their salary if they were unemployed! Questions with this type of selection were used to reduce the number of questions submitted to each person. Another example, if you live in Brazil, you don’t need to answer questions about abroad! I believe this was one of the most interesting features of Quest 2.
The control of multiple answers was developed to solve the problem of not being able to know which of the answers was the most important. For example, when we asked in 2022: Which version of Python do you use? The person could answer 3.10, 3.6, and 2.7, but we would have no way of knowing which of the three was the most used. With the new program, this problem was solved with the possibility of ordering the answers and thus giving weight to each option. For example, by choosing 3.10, 3.6, and 2.7 in that order, the person chose three answers. To calculate the weight, I summed 1 + 2 + 3 = 6 and used this value to calculate the importance of each question. Then it was just a matter of dividing by the inverted position of the answer; for example, the first answer has a weight of 3/6 (50%), the second 2/6, and the third 1/6. I believe this control alone contributed to a good improvement in the quality of the results, although its presentation and especially how to explain its use still need to be improved in the next survey.
Low number of messages in the Telegram group#
The months of March and April 2023 were quite quiet in terms of the number of messages in the Python Brazil group.
Between January and April 2023, we can see in the usage graphs that there was a decrease in the number of active users. Here, an active user is one who posts at least one message a day.
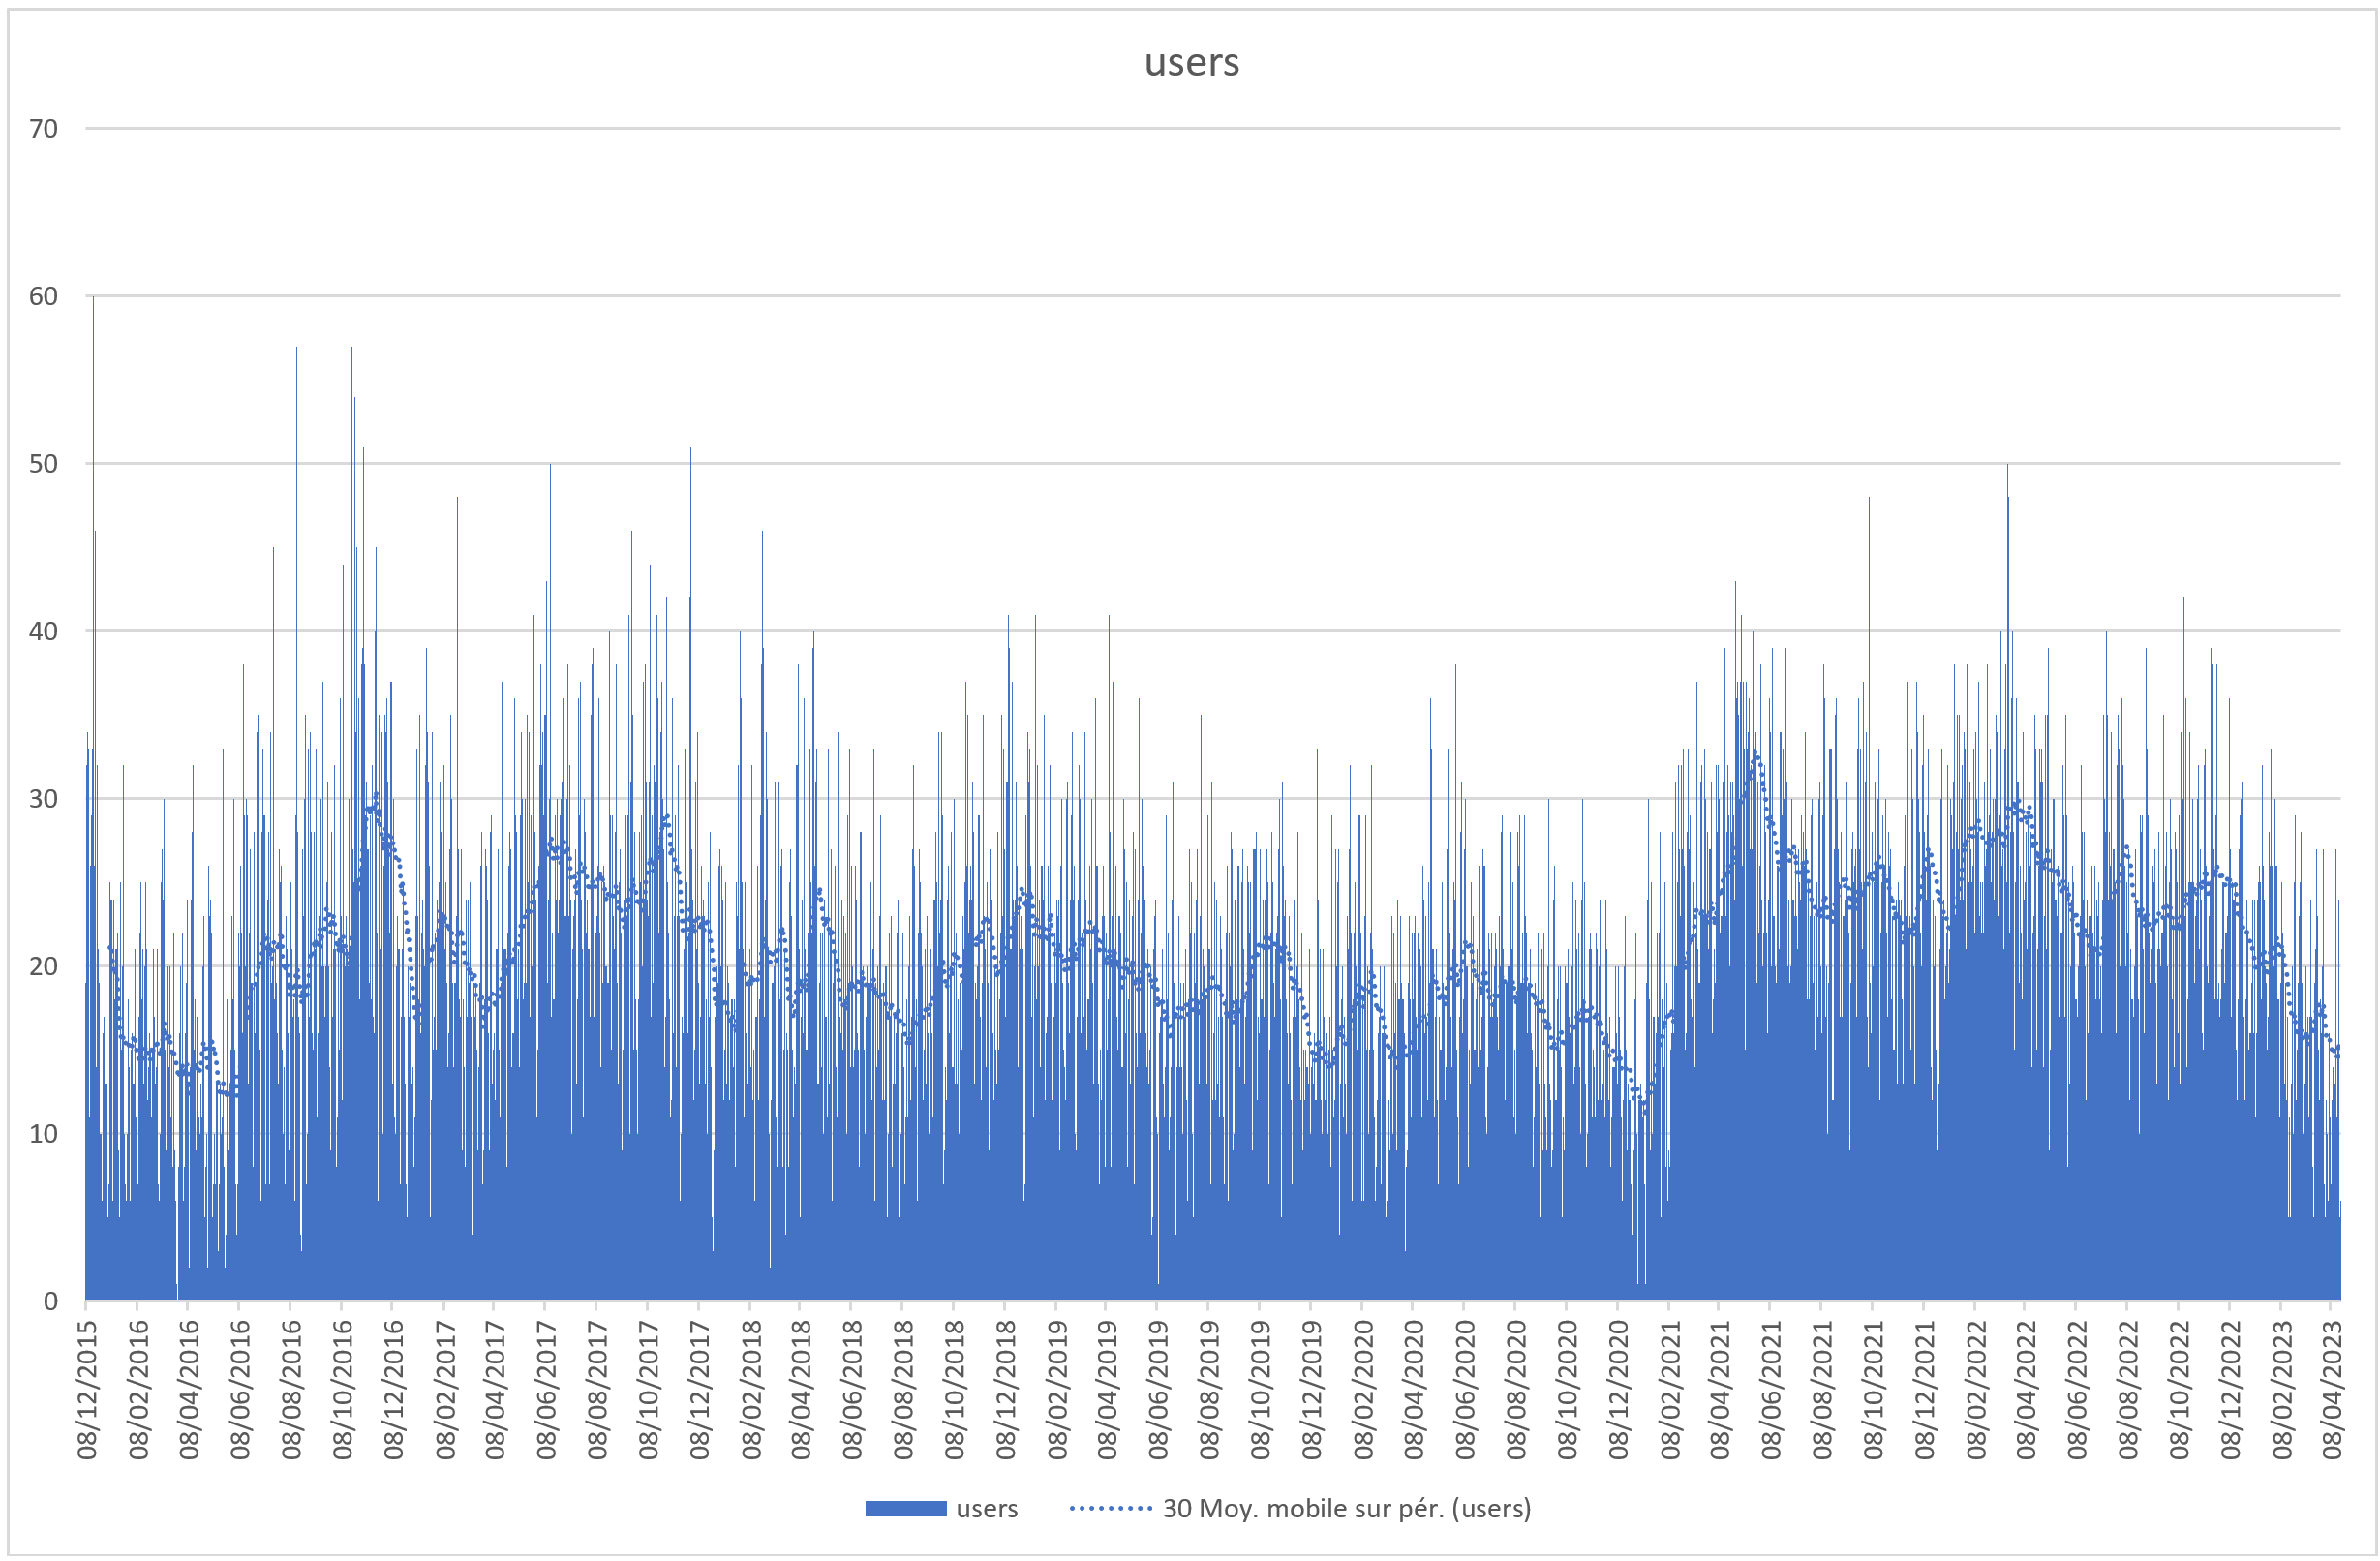
Whether the reduction is seasonal or linked to other events is difficult to determine for sure. At the same time as the survey, ChatGPT started circulating, and perhaps some of the people who used to post in the group migrated to this new tool, as the results are already very good for basic questions.
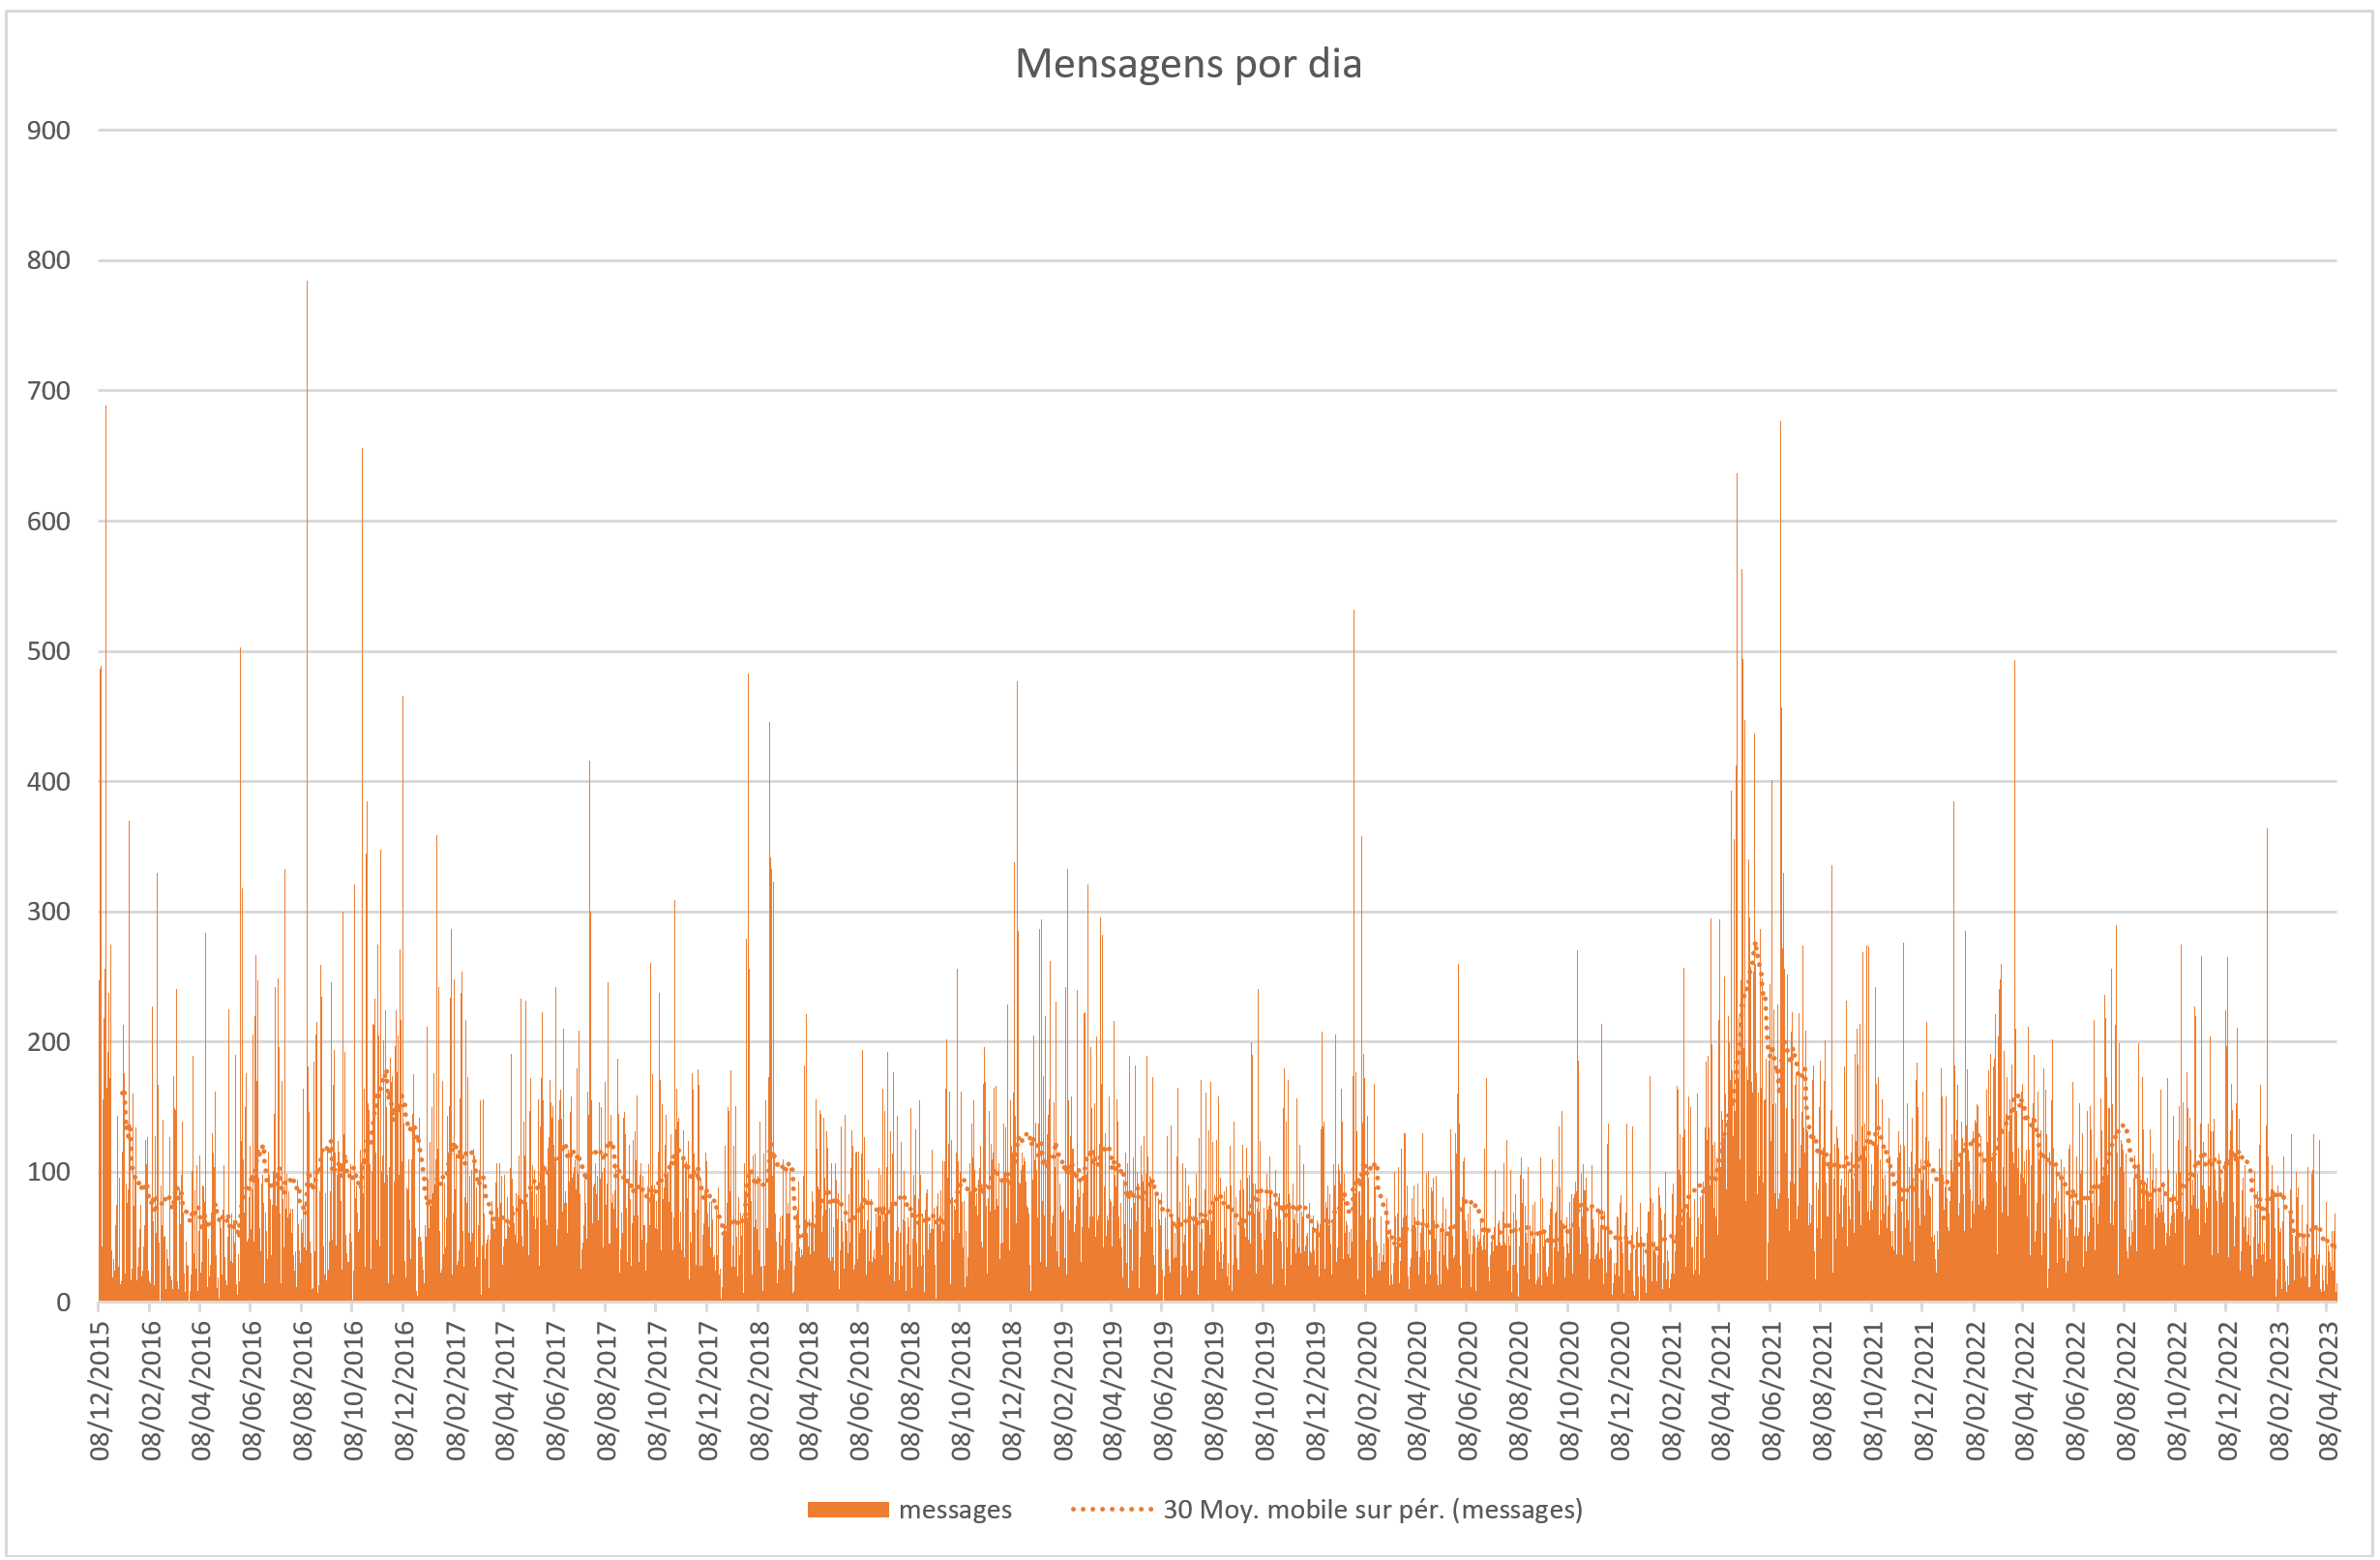
The number of messages during January and April also saw a significant drop, but we can notice that at the beginning of the year, the number of messages is lower than during the month of October, for example.
The survey was announced in the Python Brazil group, but with limited success. In 2023, the message to participate in the survey was not pinned by the channel administrators, probably due to suspicion of commercial use of the data or simple pressure from members against conducting the survey. This may also explain the low participation, although I do not believe it was the biggest influence. The channel has been emptying, and additional ways to reach the community need to be found, especially among the growing data science community, which is usually organized in other groups.
The Python Brazil channel on Telegram was one of the most impactful in terms of response rate, with over 20,000 participants, each post had between 4,900 and 6,800 views! I tried to post once a week to avoid spamming the channel.
The Python group on LinkedIn was also used as a means of announcement, but with more limited results, even though it has over 30,000 members.
Little community participation in forwarding messages#
The impression is that the survey came at a bad time and was poorly received by a good part of the community. It may just be an impression, but many people hesitated to forward the survey and help with the campaign. Running the survey at the end of summer may not have helped either.
I still do not understand the level of distrust in the community, where some people demanded proof of how the data would be used, etc. Such aggression against a volunteer effort still baffles me. Even the use of the data being protected by GDPR was not enough. In 2024, a campaign before the survey should be organized to clarify the objectives.
For my part, you can rest assured that the data was disclosed and anonymized as promised. No commercial use of this research data will be made on my part. The emails and accounts on Auth0 will be destroyed by the end of the month.
Results#
Let’s get to the results! I present some graphs and make comments on each question/answer. You can also download the raw results and generate your own analysis.
Some graphs are available in PNG format, others in SVG. The page style may alter the size of some images, but they are usually quite large; just right-click to view them in their original size in another tab.
Which version(s) of Python do you currently use as your main one?#

Here we have a pleasant surprise; the community embraced version 3.11 of Python, with almost 36% usage, followed by versions 3.10 and 3.9. In 2022, the result was a bit different, with the last three versions having very close results. Another important point is that version 2.7 has fallen out of use (and it was about time).
The rapid adoption of new versions shows that the community believes in the development process and adopts new versions as soon as they are released. We know that nothing is perfect and that sometimes we need to wait for dependencies to be updated before migrating, but it is a promising sign.
What operating system do you use?#

Here the result is practically the same as in 2022, Windows in first place and Linux right after. Lucky for the community that Python runs well on Windows and Linux, as well as macOS, of course.
What equipment(s) do you use to program?#

Here we see an increase in the participation of laptops and a reduction in the number of desktops. The participation of mobile phones dropped from 5.9% in 2022 to 2.27% in 2023, but perhaps this result can be explained by the population reached by the survey.
Which IDE or text editor do you use the most when programming in Python?#

Which IDE or text editor is most used for programming in Python is a recurring question in the group and perhaps one of the doubts of those starting to use the language. In 2023, Microsoft’s Visual Studio Code asserts its dominance, increasing its participation from 41.1% in 2022 to 58.9% in 2023! PyCharm remains quite used, but dropped from 27.9% in 2022 to 23.4% in 2023. An honorable mention goes to vim, which only dropped from 7.6% to 6.22%, remaining in third place in the survey. One of the biggest drops was that of Sublime, which fell from 7.3% in 2022 to 2.18% in 2023.
I myself migrated from Sublime to Microsoft’s Visual Studio Code. The number of extensions and the fact that it is cross-platform helps a lot. At this moment, I am writing the post in Visual Studio Code, using an extension that provides markdown preview while I write.
Microsoft has shown its teeth in the past, especially in monopoly situations. Let’s see if the company has really changed and will allow Visual Studio Code to continue developing based on what developers want.
For what do you use Python?#
As in 2022, we have a large participation of people who are still studying programming, followed by Web and Data Science, also without significant changes since last year.
This question is selective and gives access to more specific questions in some areas, which explains the different participation in the following answers.
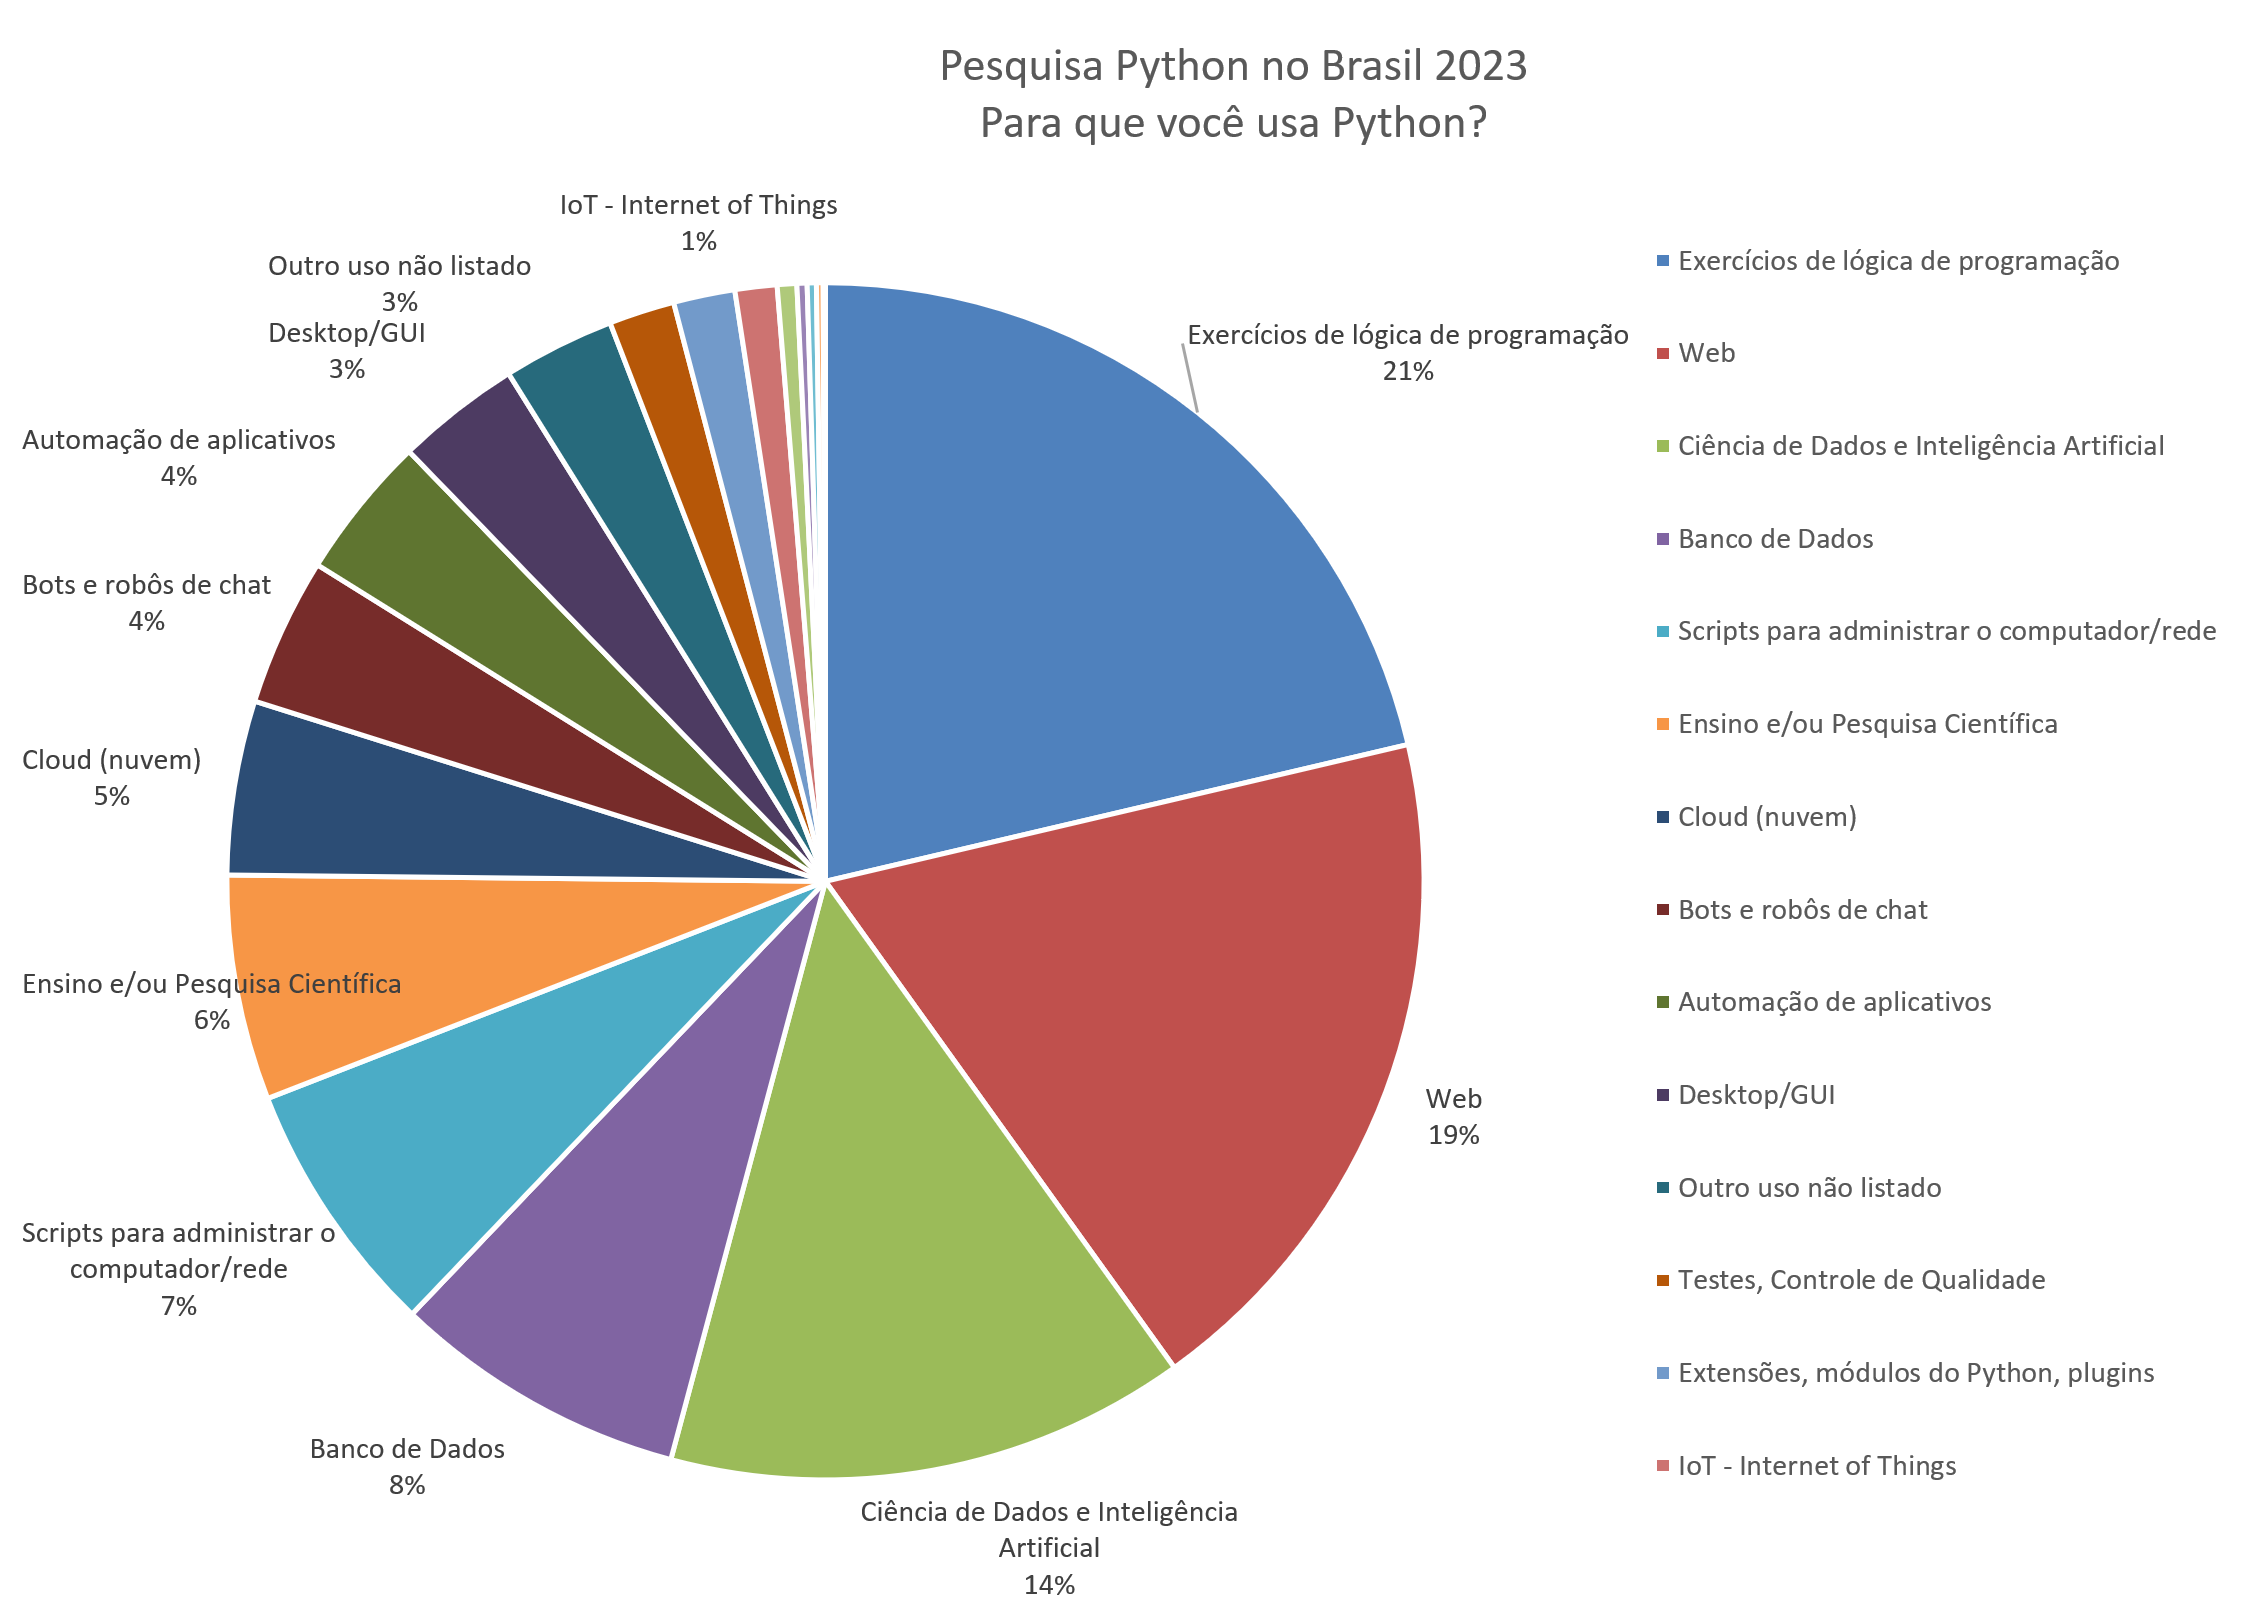
Since this question has multiple options, here is the table for better visualization of the values. Here the weight was calculated as described earlier, based on the number of responses and their order.
| Use | Weight |
|---|---|
| Logic programming exercises | 82.97 |
| Web | 73.00 |
| Data Science and Artificial Intelligence | 54.71 |
| Databases | 31.03 |
| Scripts to manage the computer/network | 27.06 |
| Teaching and/or Scientific Research | 23.64 |
| Cloud (cloud) | 18.28 |
| Chatbots and chat robots | 15.56 |
| Application automation | 15.11 |
| Desktop/GUI | 13.10 |
| Other unlisted use | 11.75 |
| Quality Control Testing | 6.91 |
| Python modules/plugins | 6.46 |
| IoT - Internet of Things | 4.41 |
| Security | 2.05 |
| Games | 1.06 |
| Mobile phones/telephony | 0.96 |
| Video, audio, or multimedia production | 0.71 |
| Malicious sciences, illegal acts, malware, intellectual property theft, spam, ransomware | 0.23 |
Which web frameworks do you use?#
This question was asked only to those who chose Web in the previous question. I have no data from 2022 for comparison, but it can be seen that Django dominates as the main web framework with 54.1%, followed by the new “juju” of the community, FastAPI, with 21.1%. A surprise is that FastAPI, even being a new framework, already appears ahead of Flask (Django’s traditional competitor).
FastAPI managed to unite async-based frameworks inspired by Flask, in addition to the enormous ease of getting started with it. Kudos to the developers who created an excellent framework and did not forget to document it. The backend of the survey was already written using FastAPI, PynamoDB, and Mangum, all running in a Lambda function on AWS.

Which GUI frameworks do you use?#
GUI has fallen in popularity, especially compared to the conveniences of the web, but it is a current and frequent necessity. Almost every week we have people asking in the group which framework to use.

QT seems to be the champion, followed by TKInter, which is distributed with Python. PySimpleGUI is in third place, followed by Kivy. Since 17.9% marked Other as a response, it is likely that an important option was left out of the list or that there is simply a great diversity of GUI frameworks used by the community.
Which cloud providers do you use?#

Here there are no surprises, with AWS (Amazon Web Services), Google Cloud, and Microsoft Azure in the top positions. The use of AWS is nearly 50%, but only 5% of participants claim to use Python for cloud applications. This area will likely grow in the coming years with the competition of serverless services and cheaper container hosting.
Which database do you use?#

Among the most used databases, the first position went to PostgreSQL with 31.7%, followed by SQLite at 25.9% and MariaDB/MySQL at 14%. All three top positions are traditional SQL-based relational databases, with PostgreSQL being one of the most generic, but with support for JSON fields and specialized indexes that allow full-text search and location-based queries, among other features.
As for NoSQL databases, we have MongoDB (6.6%), Redis (4.9%), DynamoDB (1.48%), and Cassandra (1.26%) in the top spots, but with low participation compared to SQL databases.
Which tools/applications do you create extensions/plugins with Python?#

In terms of plugins, we still do not have the appropriate set of options; 65.5% of responses were Other. Cython, Blender, GIMP, and FreeCAD are the top four tools where the community uses Python to create extensions or plugins.
Which frameworks/libraries/tools do you use the most for data science?#

Data science is an area where Python is very strong and is already the second most used by the community. Since each data scientist or data engineer uses several tools, defining the most important one is difficult. In this regard, the ability to offer multiple choices with ordering was very useful. The most used tools were Jupyter, Pandas, and NumPy.
This question can serve as a basis for those starting with data science, at least to have a range of options for which libraries/frameworks to look at first.
For what do you use Python with data science/artificial intelligence?#

Machine Learning, Big Data, Web Scraping, and Computer Vision were the most used areas. A surprise was ChatGPT, which had been launched almost in parallel with the survey.
Do you use types (typing) in Python?#

Support for type declaration in Python is not new, but it is a topic that divides the community. Some people have no idea what it is, while others simply dislike the idea. Python has always been a scripting language, interpreted and not requiring type declarations, although it is typed. Typing provides support for optional type declarations that help text editors and IDEs suggest or provide better hints about the code, in addition to being used in larger projects for static code analysis and error detection.
Example:
def a(b: int) -> str:
    return str(b + 1)
The survey shows that a good part of the community is not even aware of typing (37%). 30% declare using it, 25% do not use it but are aware of it. 6% cannot live without types, and 1% are against the use of type hints.
Do you use match/case in Python?#

Support for match provides access to pattern matching in Python. It is a relatively new feature, introduced in Python 3.10.
Example:
match a:
    case 1:
       print("One")
    case 2:
       print("Two")
    case [3, "Three"]:
       print("Three")
    case _: # Default
       print("I don't know this number")
Unlike type hints, here the majority of responses (42%) say they know the feature but do not use it. 38% do not even know it exists, and only 20% say they use it. It will be interesting to see the results of 2024 to check if this feature becomes more known, as it may start to be used in courses and become more common.
How do you learn/learned Python?#

In the ways of learning Python, we see an increase in self-taught individuals, from 23.7% in 2022 to 32% in 2023. Free courses come in second place with 31.7%. There was a drop in the participation of videos from 19% to 10%.
The ways of studying and learning are constantly evolving. In the coming years, this question needs to be more detailed, as even self-taught individuals need materials to study. In 2024, we will have other options to differentiate the support for study/learning from the method of study itself. This will be done to clarify videos from free courses, for example.
What was your first programming language?#

No surprise here, Python was the first choice (31%), followed by C (20%) and Pascal (15%).
The presence of Pascal and Basic brings back good memories, as they were widely used in the 80s!
In what year did you start programming?#
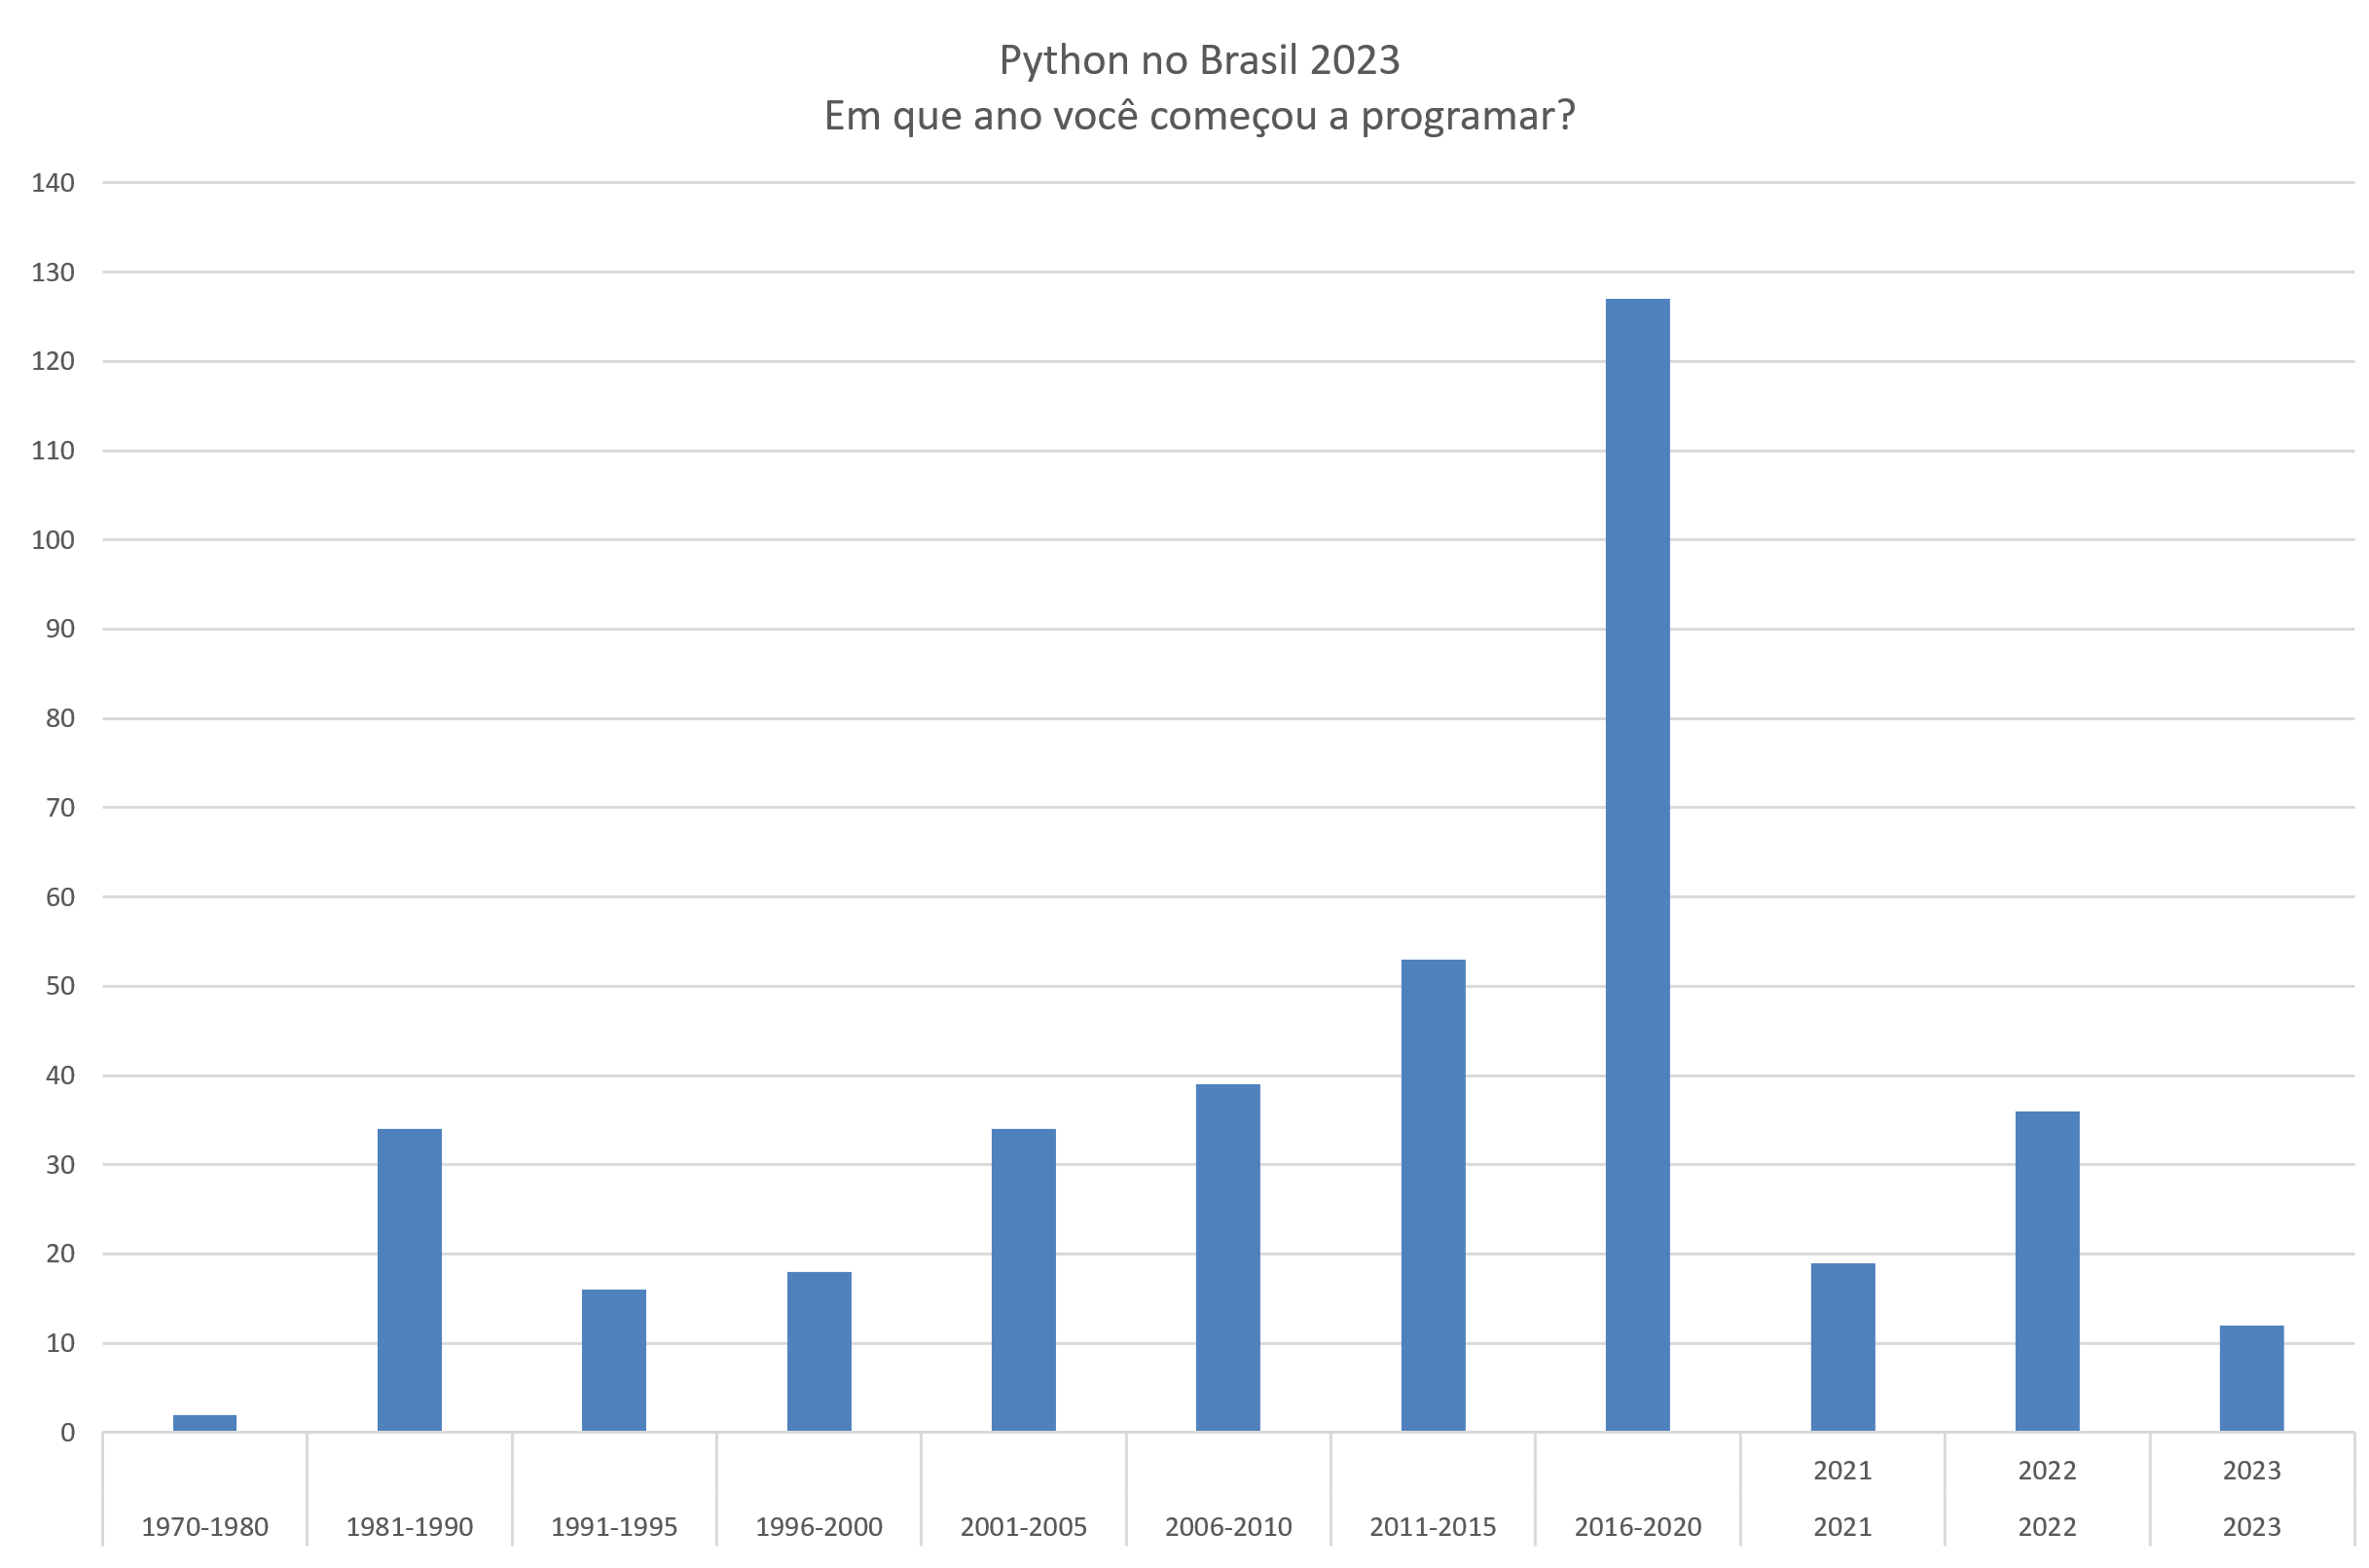
Here we confirm that most participants started programming recently, between 2016 and 2020, followed by a large group between 2000 and 2015.
Besides Python, do you currently use other programming languages?#

JavaScript is the most used language by those who work with Python, after Python, of course. The following positions are Java, C, and C++. Other languages accounted for 20%, confirming the great variety of languages used by the community.
New languages like Go (5.47%) and Rust (1.79%) also appear in the survey. Let’s see how this mix evolves in 2024.
How long have you been a member of Python Brazil (Telegram group https://t.me/pythonbr)?#

Here, we had a change compared to 2022. In 2022, 41% of those who responded to the survey were not members of the Python Brazil Telegram group. In 2023, only 32% were not members. This confirms the impression that the survey was not widely disseminated outside the group. As in 2022, the vast majority (35%) have been members for less than 1 year (sum of Less than 1 year, Less than 6 months, and Less than 3 months).
What do you like about the Python Brazil group (Telegram)?#

Here the results speak for themselves. The group, although not very frequented, remains friendly, thanks to the community and the work of the moderators.
What do you dislike about the Python Brazil group (Telegram)?#

Did you know that we have a Python Brazil Association?#

Here the association is recognizedly unknown to most, but this result was already expected, as the association’s goal is quite specific (to support the community in organizing events).
Select your main occupation. You can choose more than one option and order them.#

This is one of the most complicated questions in the survey. Since the text of the options is long, it was shortened in some graphs.
Sex or current gender identity#

Undoubtedly the most controversial question. I think today no one knows how to ask this question without offending someone.
The idea of including this question came from feedback received in 2022, where we had no way to differentiate salaries between men and women. It is a complex question, as for the survey it does not matter the sex a person was born with, but how they present themselves to society. Perhaps a modification in Quest that allows the creation of questions and sub-questions in the future. Depending on the community’s feedback, this question will be removed in 2024.
The overwhelming majority is male, which makes it impossible to use the results statistically. But the data is available, and I hope that more specific analyses will be made in the future. Here, the community’s feedback, as always, is very important.
What is your highest degree?#

Another complicated question, as some people wanted to answer with multiple options. The goal of the survey is not to replace a person’s Lattes curriculum, but to create categories that can be explored. In the middle of the survey, the category “university student” was added at requests, although it is not a degree, it is an important category in Brazil, where people start working before graduating and sometimes never graduate. I spent several years at the university level and know how that pre-degree period is.
What type of school did you attend before entering college?#

In which country do you currently live?#

In which country do you live?#
Question presented only to those who chose the Abroad option in the previous question.

A small detour to Belgium, due to my participation and pestering friends to respond to the survey. People from EuroPyBR can attest to that :-D
In which state do you live?#
Question presented only to those living in Brazil.

Great participation from São Paulo, the most populous state in Brazil and home to the most active community. Amazonas also had significant participation, due to PyNorte and the fact that I am native to this state, which makes it easier to contact friends and colleagues.
If you participate in any regional group, which one?#
| Group | Members |
|---|---|
| Not participating | 66 |
| PyNorte | 11 |
| Grupy-SP | 5 |
| Grupy-RN | 4 |
| PUG-PB | 4 |
| GruPy Blumenau | 3 |
| Grupy-RP | 3 |
| PUG-SE | 3 |
| PyTchê | 3 |
| Python Rio | 3 |
| HB Network | 2 |
| PUG-CE | 2 |
| PUG-PE | 2 |
| Py013 | 2 |
| Others | 34 |
Here, the normalization work was complicated, as happens with every free field. Some groups were mentioned multiple times, as the person participated in more than one; in these cases, participation was counted in others.
Indicate the type or nature of your employment contract#
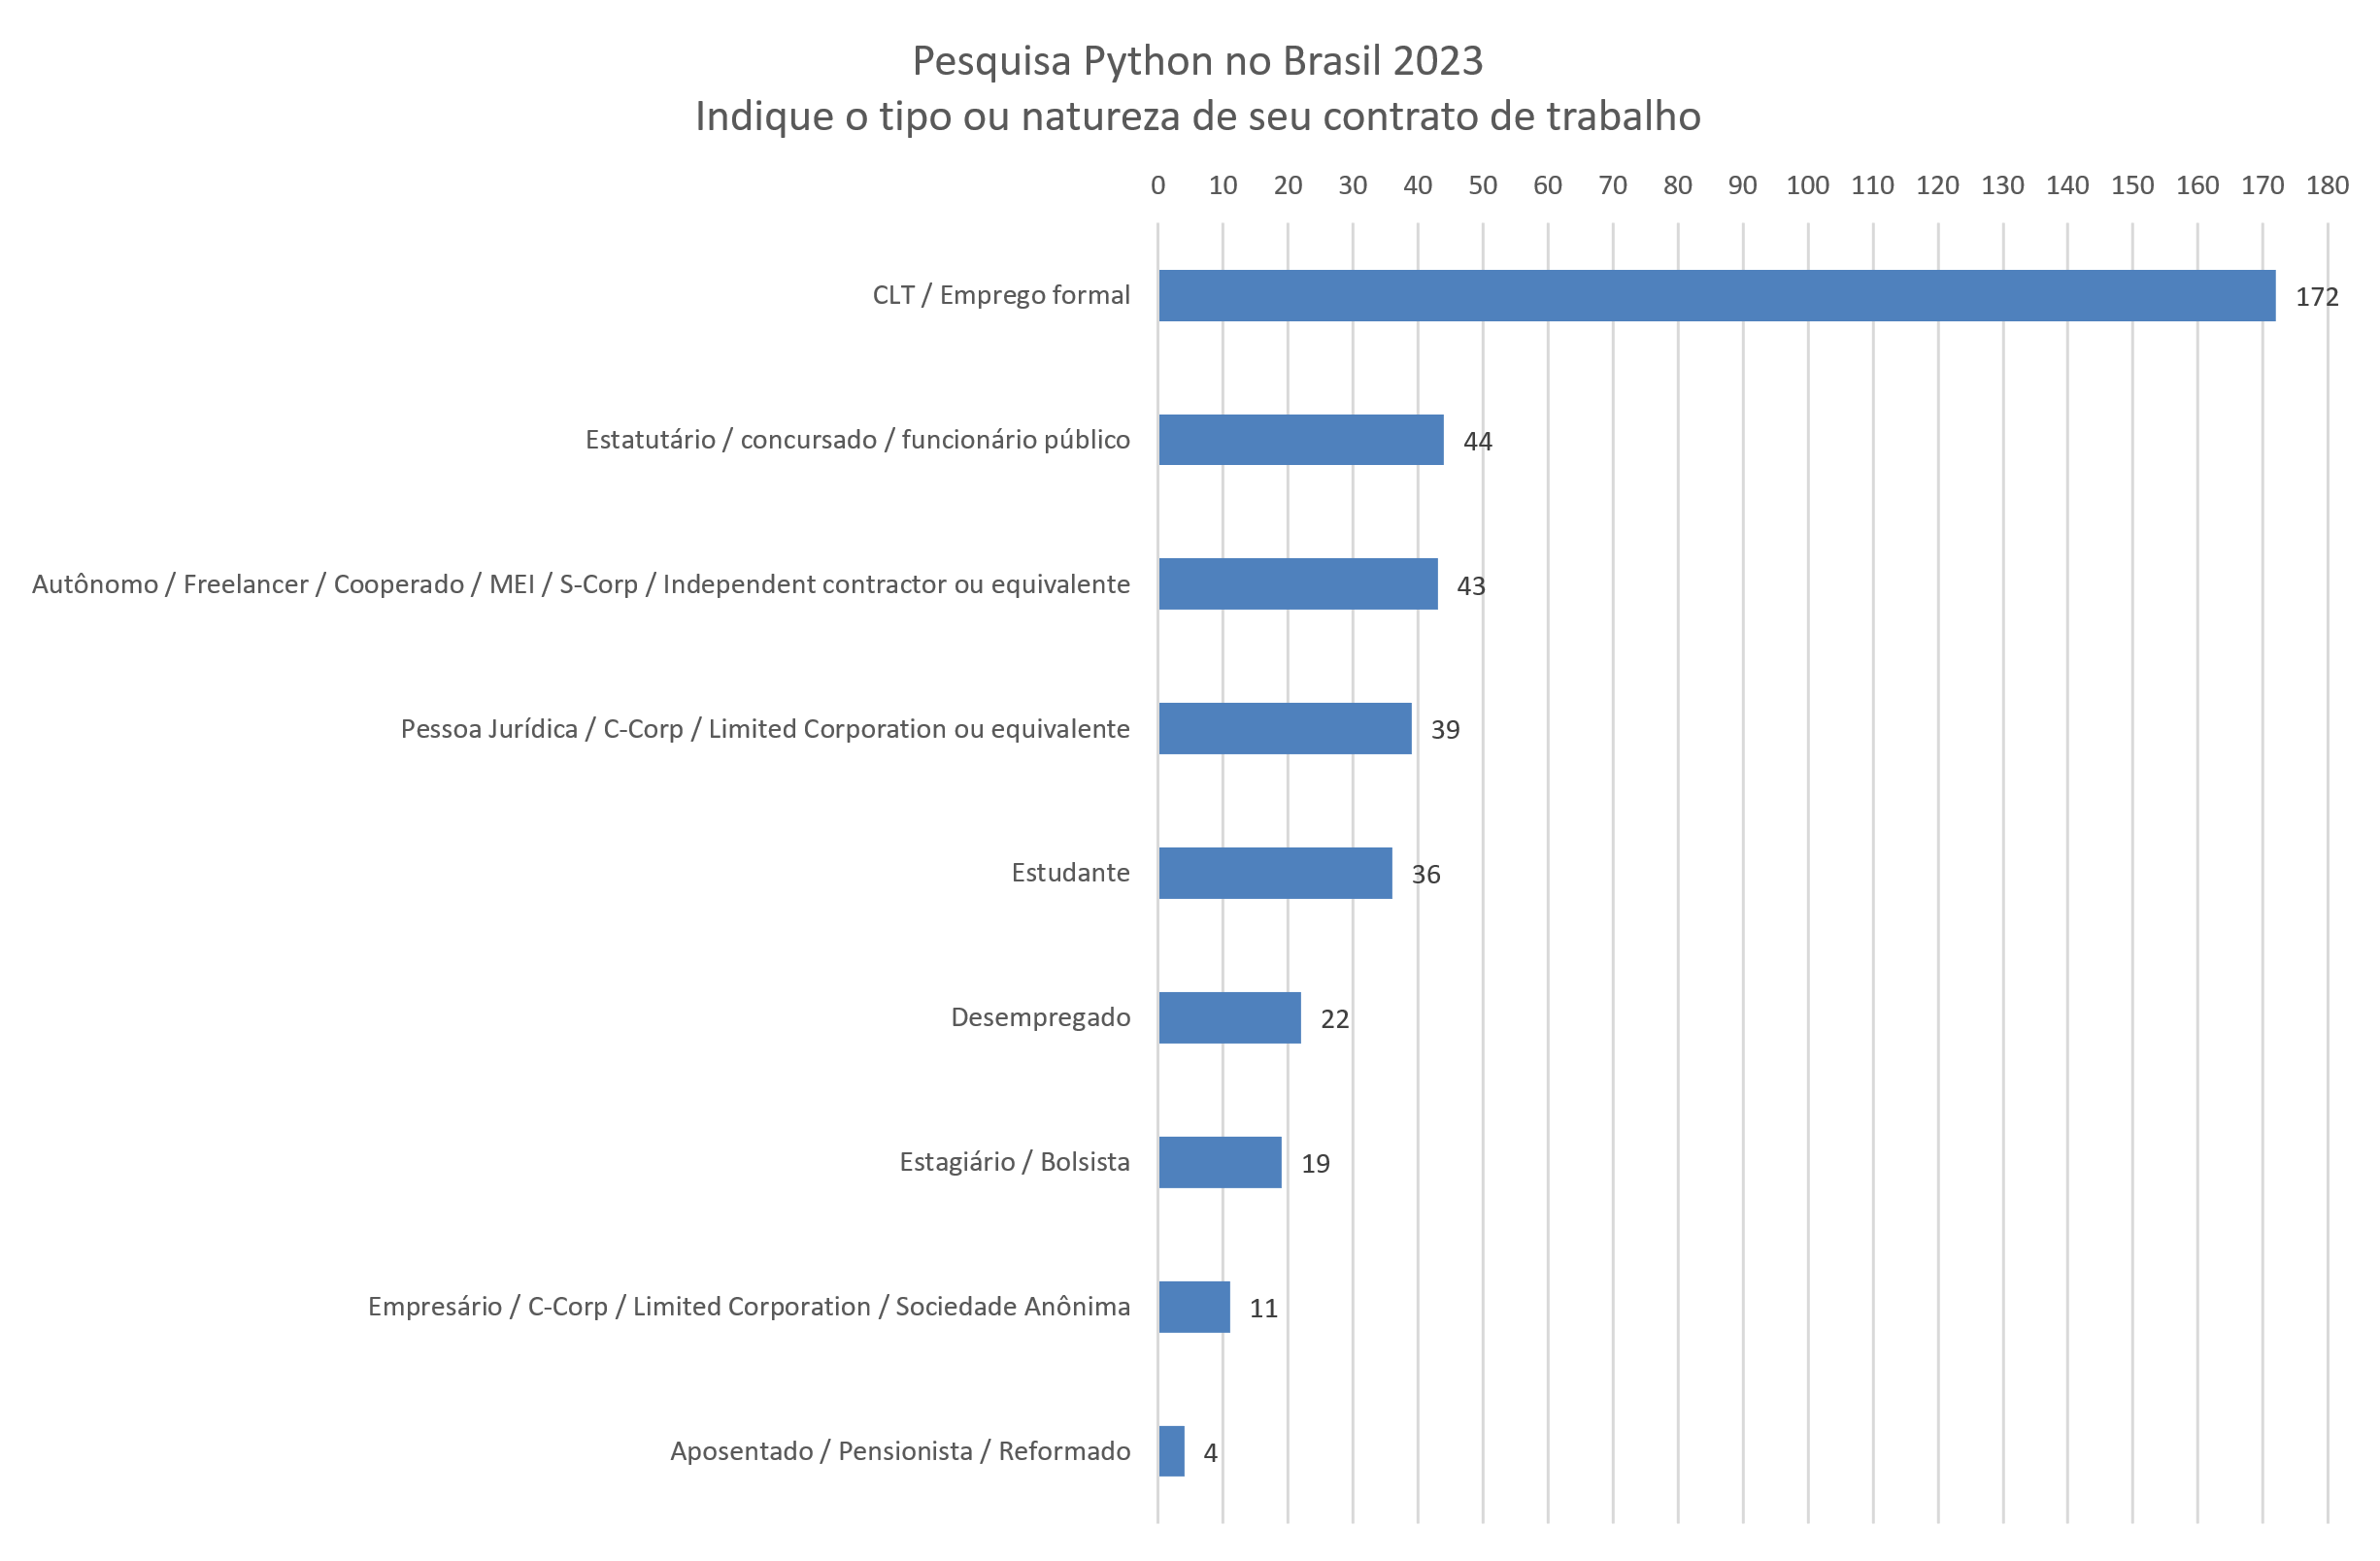
The vast majority are still under traditional employment contracts (CLT) or are public employees. But we can see a significant participation of people working as freelancers, in different forms, whether MEI, PJ, etc.
What is your gross monthly salary in reais?#
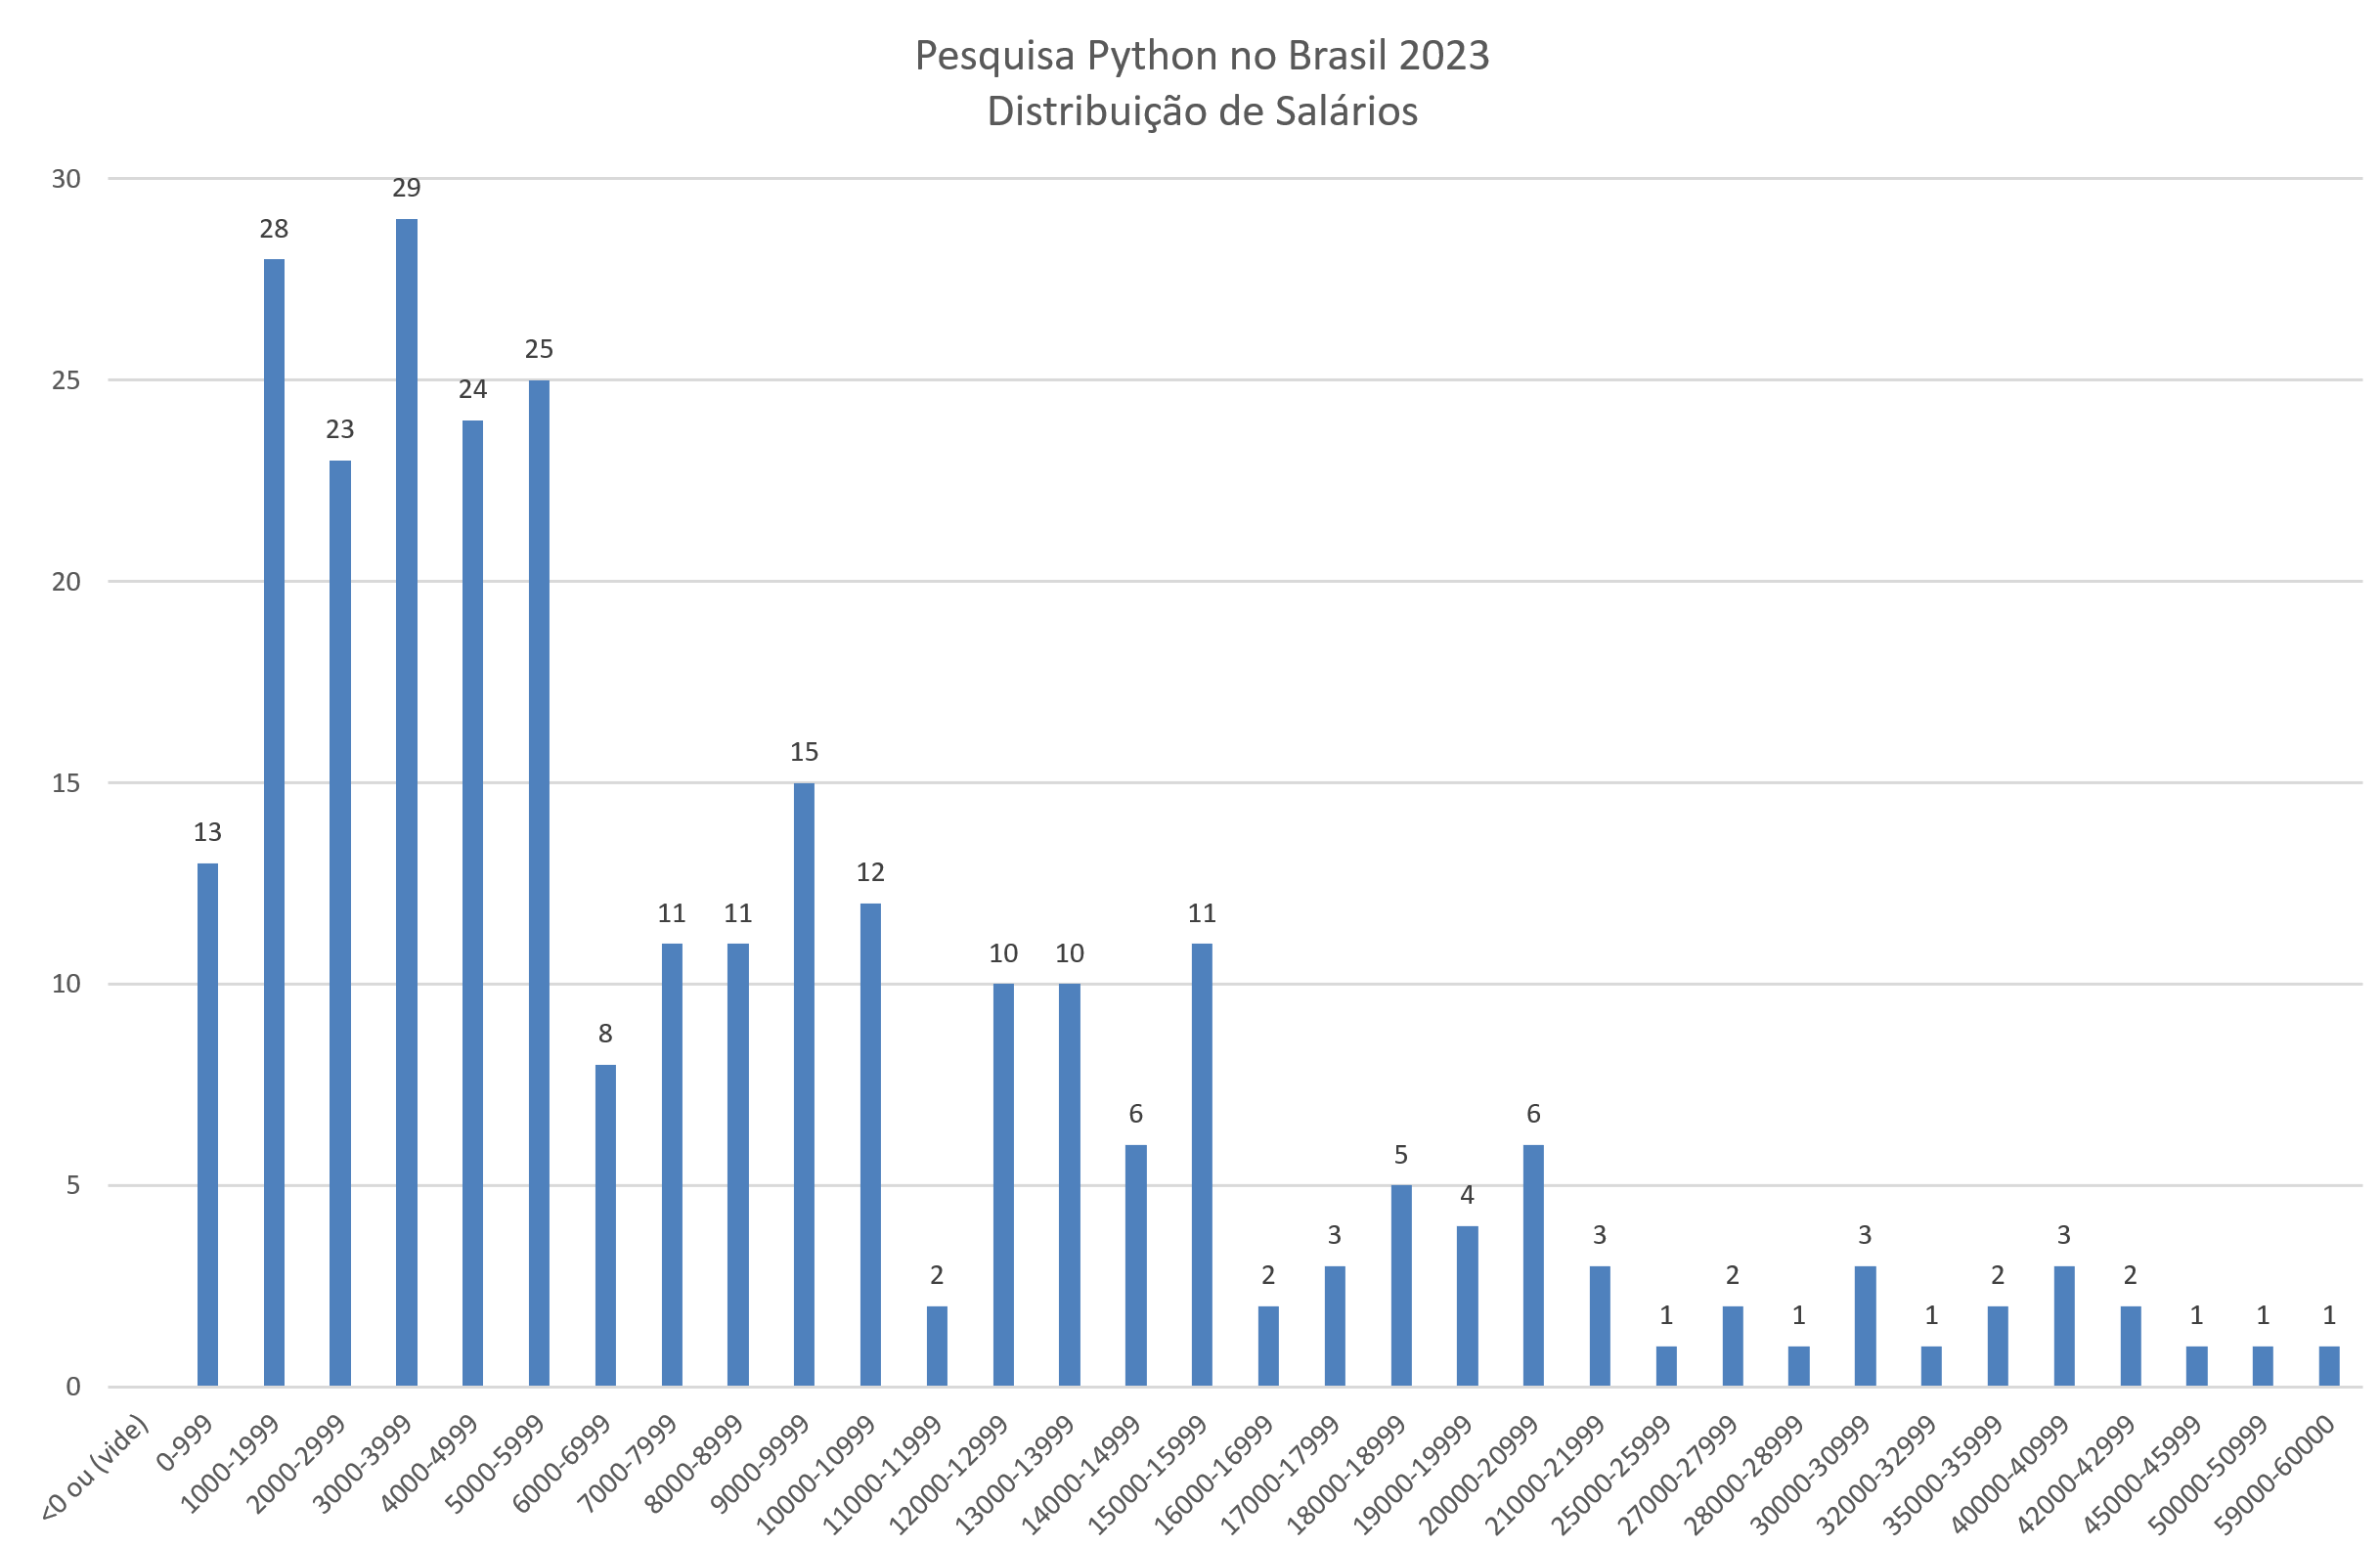
One of the questions that gave rise to this survey. We have a large group with salaries up to R$6,000.00. These results make more sense when broken down by education level and position, presented further below.
How do you work today?#

Remote work still shows great strength. Today there is a trend towards hybrid work, but it is a question that should be monitored in 2024.
Does the company you work remotely for reside in another country?#

Many people who work remotely can work from Brazil. An opportunity for those who want to earn more and already speak other languages.
In which country is the company you work for located?#
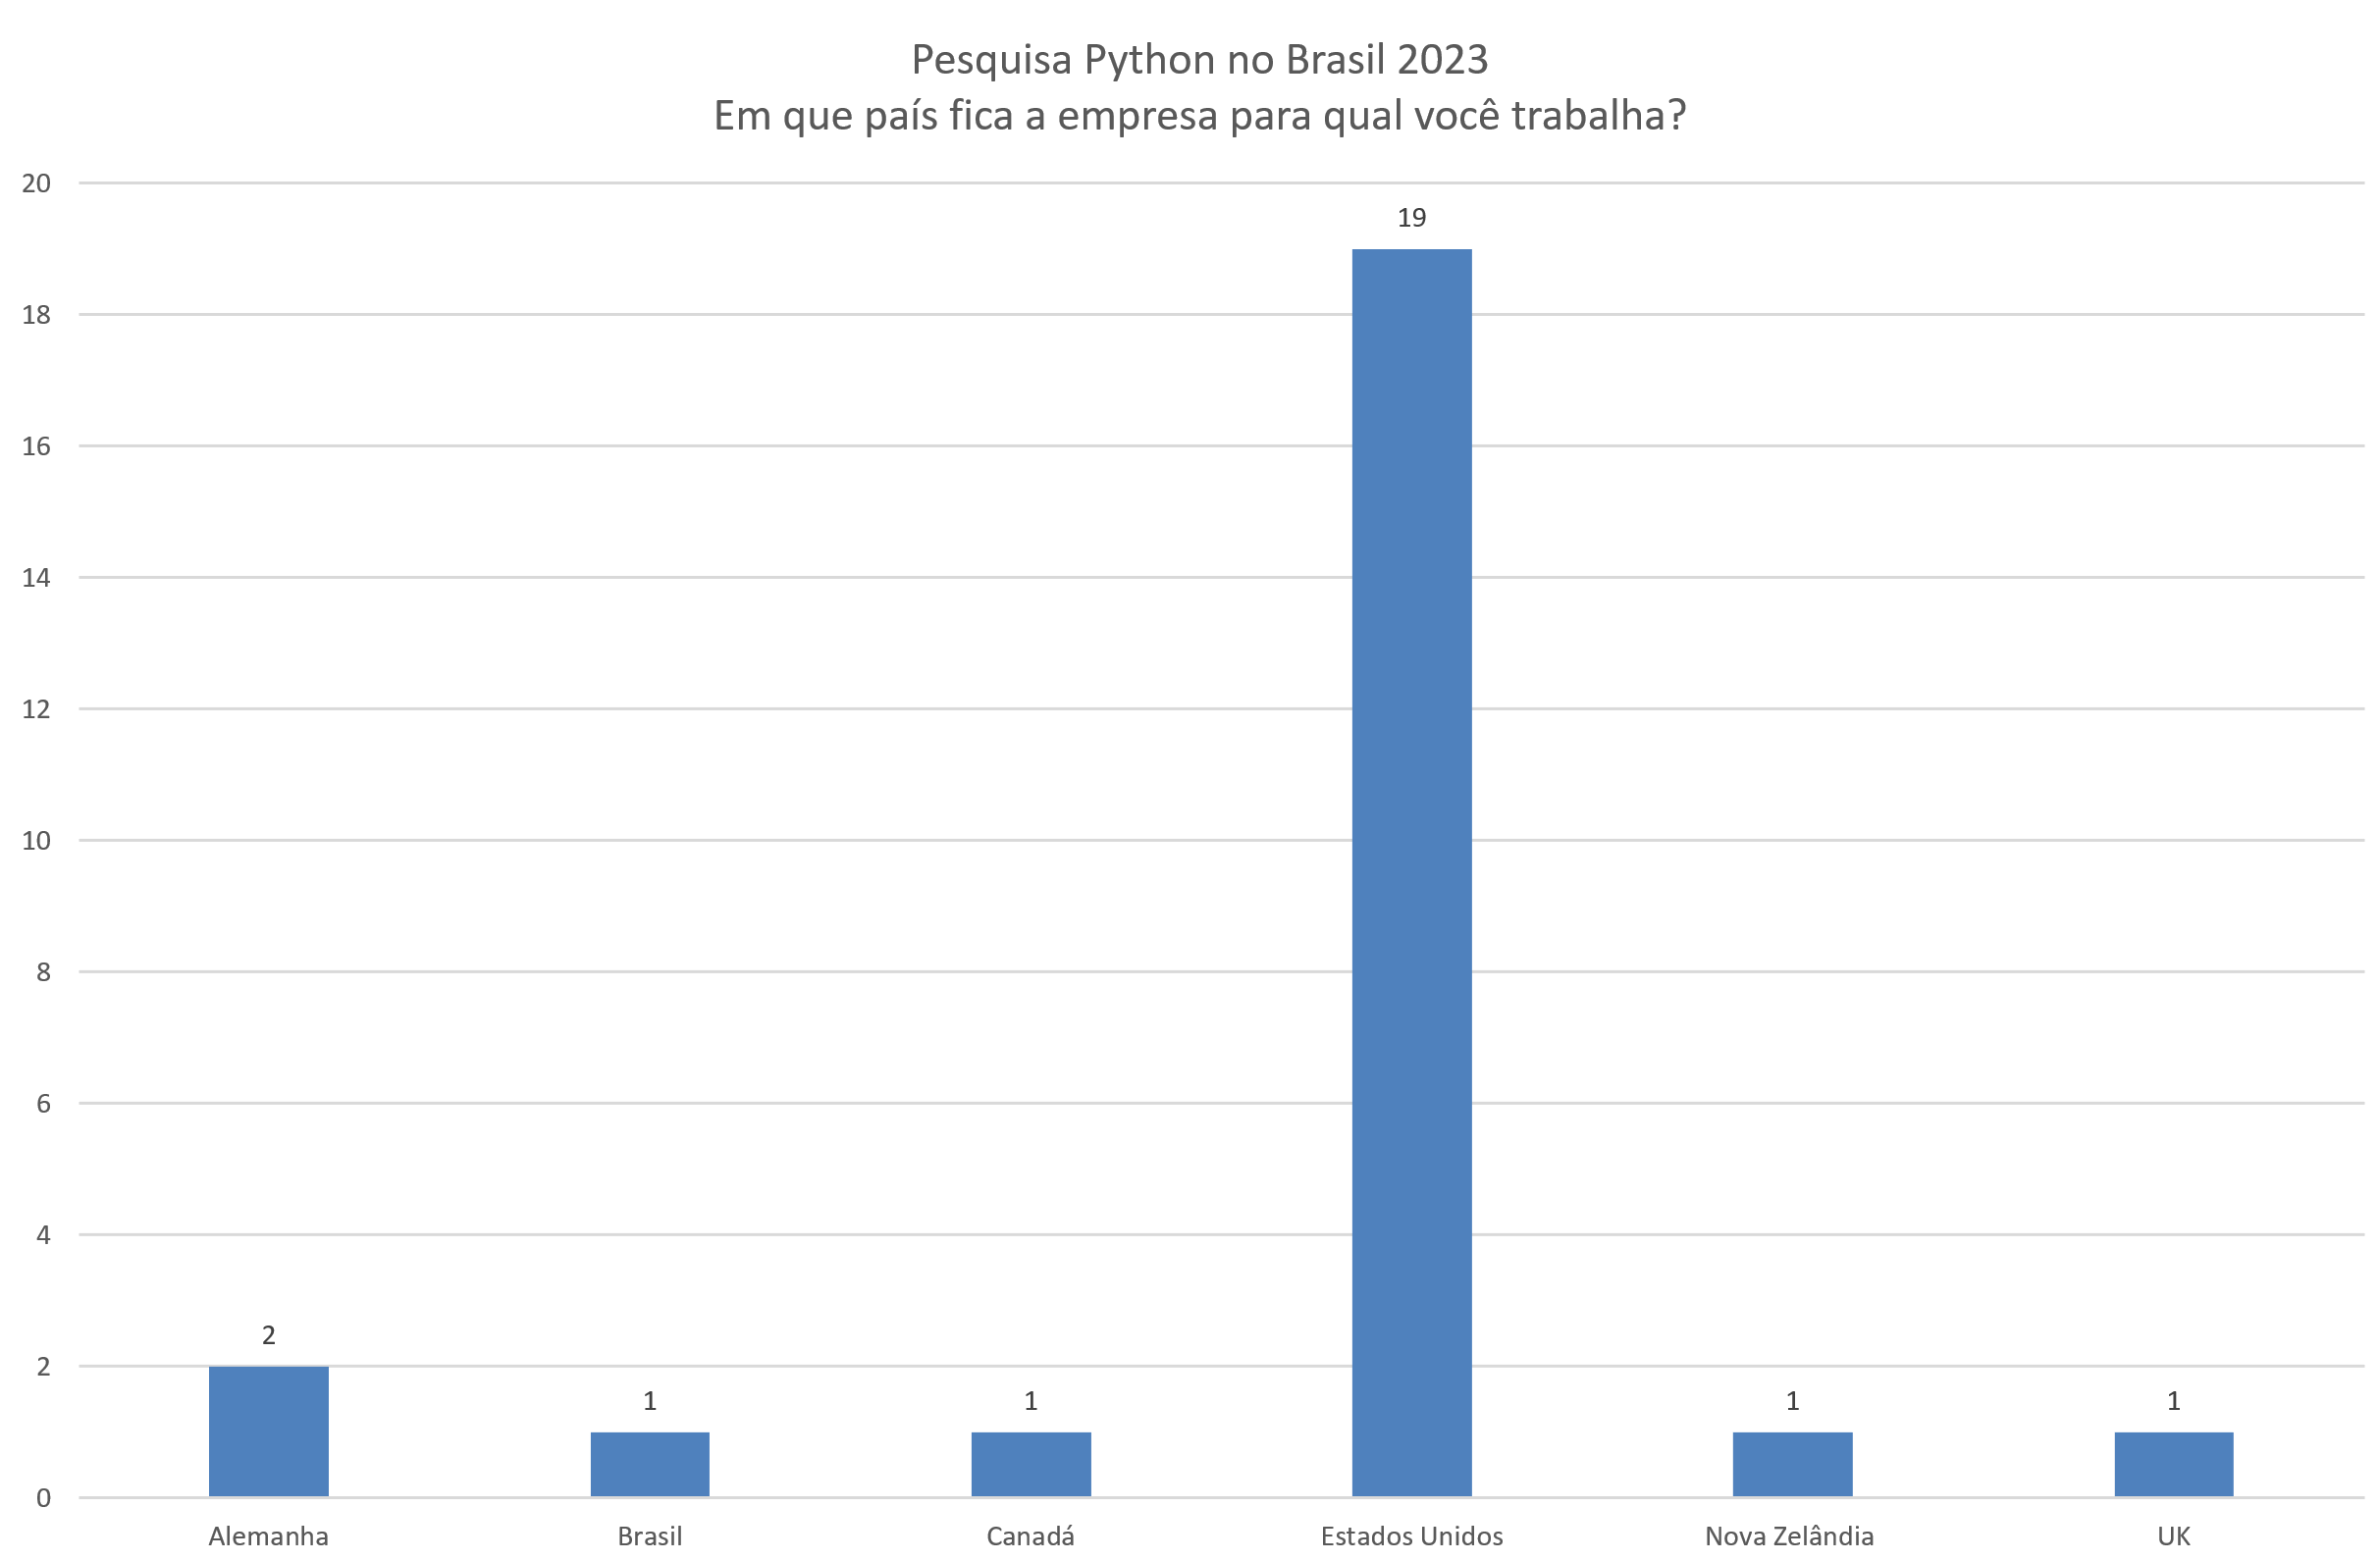
Among those who work remotely for foreign companies, we see the United States as the main country. This can be explained by the proximity of time zones and culture, as well as the US’s leadership position in technology.
Your current job title (or last) is/was#

What is your current job level?#

How is your level of English?#

Paths between education and positions#
Here is a combination of three questions that generate an interactive graph, a Sankey diagram (not always visible when accessed from a mobile phone). Reading from left to right, you can see how many seniors completed which studies and what type of job they obtained in the end. You can explore the diagram with the mouse.
The same data, but with the level of the position and the level of education.#
And the level of education with the type of employment obtained.#
Country of residence, education, and average salary#
Here we see that the level of education is very important, both in Brazil and abroad. There is a salary progression with the level of education.
Brazil#
In the case of a Master’s degree, the average is slightly lower than that of a specialization, but this may be explained by the choice of an academic career. Normally, postgraduates are employed in the industry, which pays better salaries.
Abroad#
Abroad, the situation of postgraduates changes a bit, with master’s degree holders earning more than doctors. The difference is probably linked to the academic option of doctors; in this case, we only have one respondent in the survey abroad. Another explanation is that the person is still pursuing a doctorate or post-doctorate.
Abroad, we have few data, and the results should be read with this limitation in mind.
Have you ever presented lectures at Python Brazil?#

This question will probably be removed in 2024.
Lessons Learned#
-
Mark questions that will be published: make it clear to participants which fields will be disclosed along with the final results.
-
Reduce the number of questions.
-
Organize the dissemination campaign on social media and seek people who can help with it.
-
Rethink the question about sex and gender identity.
-
Disambiguate the forms of learning vs. means of support.
-
Seek new ways to disseminate the survey.
-
Explain from the beginning how the data will be used, privacy, etc. If possible, organize a pre-campaign explaining what will be done.
-
Change the survey month from March to October.
-
Improve Quest 2 to allow sub-questions.
-
Improve and make the control of multiple choices more accessible.
Raw Data#
As promised, here is the link to download the raw data from the survey:
Click the link below to download the raw data:
Final Words#
Everything going well, the survey will be repeated in 2024. Community participation is very important to confirm interest in this type of survey and to help with new questions.
What was really missing in 2023 was someone to help with the dissemination of the survey on social media. If anyone wants to help or even exchange ideas about the 2024 survey, feel free to contact me.
I hope the community uses this data and provides even better results.
See you in 2024!